

How health insurance companies and health plans determine premium rate increases is a little bit of a mystery. Covered California didn’t add to the consumer’s understanding of this process when they released their 2015 health insurance booklet. The plan rates booklet is mostly marketing material and fails to provide specific rates by region, carrier, and plan type.
What rate increase will you get?
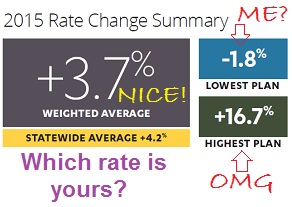
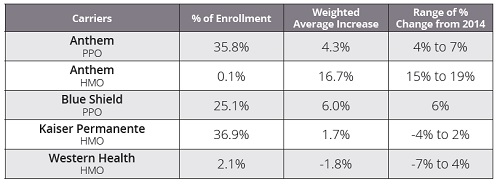
Health insurance premiums are like politics, they are all local. While the Region 3 overall rate increase was 3.7% as a weighted average, some individuals will see a 1.8% decrease and others will receive an increase over 16%. Covered California did provide a grid of carriers and their range of premium rate changes. But the missing pieces of information are the rate changes by specific plan: Bronze, Silver, Gold, or Platinum.

Did you receive the 19% rate increase or the 4% premium decrease from Covered California?
Rate increase by metal tier important
To develop a more complete picture of the Covered California individual and family plan premium rate changes for 2015 I used a variety of sources to compare 2014 to 2015 proposed rates. A large block of information came from the carrier rate filings with either the Department of Managed Health Care (DMHC) or California Department of Insurance (CDI). Strangely enough, Covered California who is supposed to be negotiating these rates, has no supporting documents for their negotiations with the health plans. When the rate filings failed to provide the base rate information, I would use the 2014 rates and compare them to the proposed 2015 rates. The rates could changes upon review of either the DMHC or CDI.
PDF Pipeline Documents
There is a tremendous amount of information that the carriers supply to the particular bureaucracy for review. Note that the rates are reviewed against the supporting documents that justify the carrier’s increase or decrease. No bureaucracy or elected official has the power to deny a proposed health insurance premium rate increase. That might occur if Proposition 45 passes this November. (See: Covered California leans against Prop. 45.) But the reviewers can ask lots of questions about complicated statistical assumptions that are the foundation for the rate increases. The bulk of the rate filing information can be found in the PDF Pipeline documents (available at the end of the post) filed with the Department of Managed Health Care at http://wpso.dmhc.ca.gov/ratereview/ . Health Net IFP rate filings can be found at the California Department of Insurance website https://interactive.web.insurance.ca.gov/apex/f?p=102:2:0::NO:::
Rate changes for adults 21 to 64
The base rate of all individual and family plans is the premium rate for a 21 year old adult. This is because the ACA says the highest rate at age 64 can be no more than three times the base rate. So if you know the current and proposed 21 year old rate, you can determine the percentage increase or decrease for all of the age ranges over 21. Rates for ages less than 21 are either equal to or less than the base rate. Consequently, my data reflects the premiums for adults 21 and older.
All plans now include children’s dental benefits
The individual and family plans offered through Covered California for 2015 will have the new embedded benefit of Pediatric Dental. In 2014, if parents wanted Pediatric Dental for their children they had to purchase it separately. (See: Did you miss the children’s dental plans? ) It is now included in all plan just like health plans off exchange and small group plans. None of the rate filings really spoke to the cost impact of adding the children’s dental benefit. One plan mentioned in passing that they thought the Pediatric Dental component added an addition .9% increase to the cost of the plans.
On and off exchange plans
If the proposed rate increases are allowed to go into effect for 2015, they will apply to the identical off-exchange plans offered by the respective carrier as well. This means that most of the on and off exchange plans will increase or decrease by a similar percentage. Some health insurance companies offer other individual and family health plans that are not identical to those offered through Covered California. I did not compare the off-exchange plan rates.
Trends in health care costs
At the simplest level possible, the carriers justify their rate increases based on past claims experience and expected future claims for a pool of members in a plan, within a region. They also submit third party independent actuarial analysis of their rates and justification. Within the California Plain-Language Rate Filing Description form, the carrier lists and compares their overall rate increases to that of trends in specific benefit categories. Because not all the carriers report the same percentage trend increases the same, it can be difficult to make side by side comparison.
Prescription drugs continue to increase in cost
However, a consistent trend for seven of the ten carriers was reporting prescription drug inflation of over 5%. Five of the carriers indicated they expect prescription drug costs to increase over 10% in the next year.
Overall Medical Trend Factor
Overall means the weighted average of trend factors used to determine rate increases included in the filing, weighting the factor for each aggregate benefit category by the amount of projected medical costs attributable to that category.
| IFP | 2015 Rate Increase | Overall Trend | Hospital Inpatient | Hospital Outpatient |
| Blue Cross | 5.80% | 7.10% | 4.20% | 4.20% |
| Blue Shield | 6% | 9.20% | 2.90% | 5.40% |
| Chinese HP | 9.60% | 8.72% | 14.45% | 9.10% |
| Health Net HMO | 4.80% | 6.80% | 6.60% | 6.60% |
| Kaiser | -3% | 2.90% | 2.80% | Hos. In. |
| L.A. Care | 9.20% | 1.70% | 3.50% | 4% |
| Molina | 2.30% | 6.60% | 6.60% | 6.60% |
| Sharp | 4.30% | 6.00% | 10.10% | 10.10% |
| Valley | 0.97% | N/A | N/A | N/A |
| Western Health | -1% | -1% | blank | blank |
| Heath Net EPO | 6.80% | 6.50% | 6.70% |
| IFP | Physician Services | Prescription Drug | Laboratory | Radiology |
| Blue Cross | 4.20% | 17% | Phys. | Phys. |
| Blue Shield | 4.50% | 14.20% | 2.80% | Lab |
| Chinese HP | 2.98% | 12.16% | Hos. Out. | Hos. Out |
| Health Net HMO | 5.80% | 10.40% | 6.20% | 6.20% |
| Kaiser | Hos. In. | 4.00% | Hos. In. | Hos. In. |
| L.A. Care | 0.50% | 0% | 0.50% | 0.50% |
| Molina | 6.60% | 6.60% | 6.60% | 6.60% |
| Sharp | 10.10% | 10.80% | 10.20% | 10.20% |
| Valley | N/A | N/A | N/A | N/A |
| Western Health | blank | -1% | blank | blank |
| Heath Net EPO | 5.10% | 8.40% | 4.50% | 4.50% |
Phys., Lab, Hos. Out., Hos. In. indicates the carrier included this trend with the respective benefit category referred to.
Rate Change by Carrier, Region, Plan Comparison
Not all carriers offer plans in all regions. If a region is missing from one of the tables, the carrier does not offer a plan in that region. If there is a double dash in region row, the carrier offers a plan in that region, just not the specific type of plan (PPO, EPO, HMO) being detailed. A list of regions, average rate increases and the specific counties in each region are listed at the end of the post.
Silver plan rates increased the least
A consistent theme or coincidence among a majority of the carriers was that the Silver plans always had the smallest percentage increase relative to the Bronze, Gold or Platinum plans. Carriers with generally lower Silver plan rate increases are ABC, CCHP, L.A. Care, Molina, Sharp, VHP and WHA. One possibility for the restrained Silver rate increase is that with 59% of all Covered California enrollments in Silver plans, the membership is larger relative to the incurred claims expense of the other plans.
Tax credits based on 2nd lowest Silver plan
A Silver plan that doesn’t increase in premium as much also saves the government on tax credits. An individual or family’s Advance Premium Tax Credit (APTC) is based on the second lowest Silver plan in their region. The more affordable the Silver plans are, the less the government has to advance in premium tax credits to make the Silver plan affordable for the household. The downside is that there is less tax credit available for people to purchase the more benefits rich Gold and Platinum plans. When the Gold and Platinum plans have premium rate increases larger than the Silver plans, it makes those plans even less affordable with a smaller tax credit available to reduce the monthly premium.
Northern and Southern California different rate patterns
In Southern California the Bronze HMOs typically have the largest percentage increases. In Northern California where PPOs predominate, the Platinum plans typically have the largest proposed rate increases. It’s interesting to note that Anthem Blue Cross and Health Net don’t even offer Bronze HMO plans in Southern California instead opting to offer a Bronze EPO plan combined with Silver, Gold and Platinum HMO plans in the respective region.
Anthem Blue Cross
Anthem Blue Cross (ABC), which is a totally separate health insurance company from Blue Shield of California, has the greatest range of plan types across the different regions in California. ABC offers PPO, EPO and HMO plans. In some of the regions they will offer a PPO/HMO or EPO/HMO combinations. From the ABC rate filing, all PPO plan types had the same premium rate increase in all the regions they are offered. This is not the case with either the EPO or HMO plans where ABC changed the rates anywhere from less than 1% up to 19% with the average being a little less than 9% increase.
ABC Platinum PPO
The highest rate increase for PPO plans was the Platinum at 6.91%. From a purely anecdotal perspective, I worked with many clients that chose the Platinum plan because they were going to have medically necessary surgeries in 2014 or they were expecting a baby. As individuals get big ticket health care issues resolved, membership in the more expensive, but no deductible, Platinum plans may decrease along with the potential rate increase.
| ABC | PPO | ||||
| Region | Bronze | H.S.A | Silver | Gold | Platinum |
| 1 | 4.77% | 4.74% | 3.75% | 5.71% | 6.91% |
| 2 | 4.77% | 4.74% | 3.75% | 5.71% | 6.91% |
| 3 | 4.77% | 4.74% | 3.75% | 5.71% | 6.91% |
| 4 | — | — | — | — | — |
| 5 | 4.77% | 4.74% | 3.75% | 5.71% | 6.91% |
| 6 | 4.77% | 4.74% | 3.75% | 5.71% | 6.91% |
| 7 | 4.77% | 4.74% | 3.75% | 5.71% | 6.91% |
| 8 | 4.77% | 4.74% | 3.75% | 5.71% | 6.91% |
| 9 | 4.77% | 4.74% | 3.75% | 5.71% | 6.91% |
| 10 | 4.77% | 4.74% | 3.75% | 5.71% | 6.91% |
| 11 | 4.77% | 4.74% | 3.75% | 5.71% | 6.91% |
| 12 | 4.77% | 4.74% | 3.75% | 5.71% | 6.91% |
| 13 | 4.77% | 4.74% | 3.75% | 5.71% | 6.91% |
| 14 | 4.77% | 4.74% | 3.75% | 5.71% | 6.91% |
| 15 | — | — | — | — | — |
| 16 | — | — | — | — | — |
| 17 | 4.77% | 4.74% | 3.75% | 5.71% | 6.91% |
| 18 | — | — | — | — | — |
| 19 | — | — | — | — | — |
ABC Region 16 EPO
ABC EPO members in San Francisco and Region 16 of Los Angeles County are looking at double digit premium increases. EPOs or Exclusive Provider Organization plans that offer no out-of-network benefits are supposed to help keep health costs and claims lower for the carrier. The truly odd part of the Region 16 premium increase is that they are 30% to 40% greater than the rate increase for Region 15 which is also in Los Angeles County. How can one street in Los Angeles County be assigned an 8% increase and the next street over, in a different zip code, get hit with a 13% rate hike?
| ABC | EPO | ||||
| Region | Bronze | H.S.A | Silver | Gold | Platinum |
| 1 | — | — | — | — | — |
| 2 | — | — | — | — | — |
| 3 | — | — | — | — | — |
| 4 | 11.22% | 11.19% | 9.94% | 11.91% | 13.10% |
| 5 | — | — | — | — | — |
| 6 | — | — | — | — | — |
| 7 | — | — | — | — | — |
| 8 | — | — | — | — | — |
| 9 | — | — | — | — | — |
| 10 | — | — | — | — | — |
| 11 | — | — | — | — | — |
| 12 | — | — | — | — | — |
| 13 | — | — | — | — | — |
| 14 | — | — | — | — | — |
| 15 | 8.19% | 8.15% | 6.99% | 8.94% | 10.12% |
| 16 | 12.72% | 12.69% | 11.46% | 13.48% | 14.71% |
| 17 | — | — | — | — | — |
| 18 | 6.01% | 5.98% | 4.79% | 6.67% | 7.81% |
| 19 | 8.22% | 8.19% | 6.98% | 8.90% | 10.07% |
ABC Region 3 HMO plans
Region 3 encompassing the counties of El Dorado, Placer, Sacramento and Yolo will see nasty premium increases for Anthem Blue Cross HMO plan. From 15% for the Silver, 17% for Gold and 19% for the Platinum HMO, these rate increases represent the largest hikes of any plan type in any region in the state by a single carrier. (These are proposed rates and may be lowered before going into effect in 2015.) By contrast, Kaiser HMO plans are increasing less than 2% and the Western Health Advantage HMO plans will change from a decrease of 6% up to an increase of 4%. Anthem HMO plans in Regions 15 – 19 are proposed to increase on average 8% with no plan metal tier exceeding 10%. So what happened in Region 3 where ABC had to jack up the rates so much?
| ABC | HMO | ||
| Region | Silver | Gold | Platinum |
| 1 | — | — | — |
| 2 | — | — | — |
| 3 | 15.32% | 17.63% | 19.14% |
| 4 | — | — | — |
| 5 | — | — | — |
| 6 | — | — | — |
| 7 | 6.28% | 8.22% | 9.51% |
| 8 | — | — | — |
| 9 | — | — | — |
| 10 | — | — | — |
| 11 | 6.04% | 8.04% | 9.36% |
| 12 | — | — | — |
| 13 | — | — | — |
| 14 | — | — | — |
| 15 | 0.07% | 1.67% | 2.78% |
| 16 | 3.27% | 4.84% | 5.95% |
| 17 | 5.10% | 6.91% | 8.14% |
| 18 | 6.42% | 8.20% | 9.42% |
| 19 | 6.74% | 8.58% | 9.83% |
Blue Shield of California
Whereas many carriers made surgical-like adjustments to their rates based on metal tier and region, Blue Shield of California (BSC) just raised all their plans 6% across the board. PPO plans will go up by 6%. EPO plans will go up by 6%.
| BSC | PPO | ||||
| Region | Bronze | H.S.A | Silver | Gold | Platinum |
| 1, 2, 6, 9 | — | — | — | — | — |
| All others | 6.00% | 6.00% | 6.00% | 6.00% | 6.00% |
| BSC | EPO | ||||
| Region | Bronze | H.S.A | Silver | Gold | Platinum |
| 1, 2, 6, 9 | 6.00% | 6.00% | 6.00% | 6.00% | 6.00% |
| All others | — | — | — | — | — |
Chinese Community Health Plan
Chinese Community Health Plan (CCHP) is spiking their rates pretty good for 2015. CCHP, in Region 4, San Francisco, and Region 8, San Mateo, will see rate increases of over 8% next year. CCHP is also forecasting a 14% increase in in-patient hospital costs. There Silver plans will have the lowest increase in premium rates for 2015.
| CCHP | HMO | |||
| Regions | Bronze | Silver | Gold | Platinum |
| 4 | 9.24% | 8.17% | 9.17% | 9.63% |
| 8 | 9.05% | 8.27% | 9.32% | 9.65% |
Health Net
Every individual and family plan (IFP) rate change must be reviewed by the Department of Managed Health Care except Health Nets PPO and EPO plans. Those IFPs are reviewed by the California Department of Insurance. For 2015, Health Net is terminating their PPO plans and replacing them with EPOs. While the rate increases are the new EPO rates versus the old PPO rates, the EPO is technically a new plan with different benefits. Specifically, there is no out-of-network coverage with the EPO. Since this is a reduction in benefits, the rate increase over the 2014 PPO plans is actually higher than stated. (See: Health Net drops PPO plans in California.) For those members who wish to remain with Health Net, migrating from a PPO to an EPO, I’ve listed the premium increases where the EPO plans will be offered.
| Health Net | EPO | |||
| Region | Bronze | Silver | Gold | Platinum |
| 2 | 8.56% | 6.25% | 6.01% | 6.10% |
| 4 | 8.70% | 6.02% | 6.06% | 6.11% |
| 5 | 8.72% | 6.05% | 6.13% | 6.00% |
| 7 | 8.65% | 5.98% | 6.13% | 6.03% |
| 8 | 8.86% | 5.83% | 6.11% | 5.91% |
| 9 | 8.73% | 6.04% | 5.81% | 6.12% |
| 10 | 8.74% | 5.70% | 6.20% | 5.85% |
| 14 | 8.24% | 6.12% | 5.80% | 5.98% |
| 15 | 8.33% | — | — | — |
| 16 | 8.85% | — | — | — |
| 17 | 8.89% | — | — | — |
| 18 | 8.65% | — | — | — |
| 19 | 9.09% | — | — | — |
Health Net response to CDI question on EPO rates
The EPO plan designs are new, so this is not technically a rate increase. But, for comparison purposes, we can calculate the average rate change for a subscriber moving from our 2014 PPO to our 2015 EPO. The average rate increases for such individuals in these plans is based on comparisons with our current Individual PPO plans and membership distribution. – Health Net, June 12, 2014
Health Net HMO
Health Net offers an HMO plan, metal tiers Silver – Platinum in Regions 15 – 19. The rate increases are very modest in L.A. County, 0% – 3%. The Inland Empire, Orange San Diego counties will see higher rate increases upwards of 9% in Orange County.
| Health Net | HMO | ||
| Region | Silver | Gold | Platinum |
| 2 | — | — | — |
| 4 | — | — | — |
| 5 | — | — | — |
| 7 | — | — | — |
| 8 | — | — | — |
| 9 | — | — | — |
| 10 | — | — | — |
| 14 | — | — | — |
| 15 | 2.84% | 2.53% | 1.34% |
| 16 | 1.05% | 0.46% | -0.41% |
| 17 | 5.13% | 4.55% | 3.21% |
| 18 | 9.00% | 8.41% | 8.27% |
| 19 | 8.92% | 7.88% | 7.75% |
Kaiser
Collectively, across all plans and regions, Kaiser had the lowest rate increase of any carrier. They have several regions in which they decreased the rates by as much as 8%. The only logical question that might be asked is if Kaiser was over-priced in 2014? Kaiser also stated a low Overall Trend of medical services of 2.9%. They reported their in-patient trend increase will be 2.8%.
Did carriers inflate premium for unknown ACA enrollment?
No one was really sure how many previously uninsured individuals would suddenly apply for insurance and immediately schedule expensive in-patient hospital services. Hence, many carriers, it was assumed, hedged their bets and inflated the rates to accommodate for unexpectedly high claims. (See: Individual plans versus Small Group Rate Comparison, 2014) However, Kaiser probably attracted and retained more current and former Kaiser members. It’s possible that Kaiser has experienced lower claims because most of their new Covered California members were enrolled in other Kaiser plans and were not necessarily in need of new health care services.
Kaiser rating groups
Even though the rates are lower than the other carriers, Kaiser also seems to have been more meticulous in adjusting their rates to realize their targeted revenue. In 2014 Kaiser had ten rating groups. Each rating group had anywhere from one to four regions within it. The same rate was applied to all regions within the group. In 2015 Kaiser has rearranged the groupings and increased the number to eleven. Each number represents one of the nineteen different rating regions in California.
2014: (1-3-5), (2-6), (4-7-8-9), (10-11), 12, (13-14-19), 15, 16, 17, 18
2015: (1-3-5), 2, (4-8), (6-7), 10, 11, 12, (13-14-18), 15, (16-17), 19
- Regions 6 and 7 are now grouped together having been pulled out of other groups.
- Regions 10 and 11 had been combined, they are now separate.
- Region 16 which had been separate is now paired with region 17 that had been a stand-alone group.
- Region 18 had been separate is now grouped with 13 and 14.
- Region 19 is now a separate group having been separated from 13 and 14.
For the ultimate control Kaiser could have made each Region it’s own group so they could micro-adjust each premium within each plan. But since the grouping probably represent the costs associated with dedicated Kaiser facilities in the area, it is easier to create groups and apply the same rate change to the various plans.
Will Kaiser take a loss in 2015?
The actuarial review of the overall rate decreases by Kaiser raised a red flag. However, the review determined the rate decreases did not threaten the financial integrity of Kaiser, just that the rates may not cover all the costs. The actuary company had this to say about the proposed Kaiser rate changes.
Opinion – Not Actuarially Sound in the Aggregate
In my opinion, the proposed premium rates are not actuarially sound in the aggregate because the premium rates for Individual HMO business in California, including expected reinsurance recoveries, governmental risk adjustment cash flows, and investment income are not adequate to provide for expected health benefit costs, settlement costs, marketing and administrative expenses, and cost of required capital as provided to me by the Company. The proposed rate decrease results in a projected loss. We have reviewed the Company’s capital and surplus position and the Company will continue to exceed minimum net worth requirements with the projected loss.
Opinion – Reasonable Premium Rates
In my opinion, the proposed premium rates are reasonable. I based my opinion of reasonable rates on the factors below. The review of factors I considered was specifically required in Section A of the SB 1163:2 and SB 1163:6 Guidance, titled “Unreasonable Rate Increases.” The order of discussion below follows the order of factors listed in Section A of the SB 1163 Guidance. The assumptions, data used and other relevant information used in the rating filing development are included in Appendix C.
The projected medical loss ratio meets the federal medical loss ratio standard in the market Kaiser’s expected Individual HMO statutory medical loss ratio is 95.3% based on the ratio of projected incurred claims divided by projected revenue. The calculation of federal medical loss ratio, based the NAIC definition as presented in the Supplement Health Care Exhibit – Part I in the Annual Statement Blank, is based on several adjustments to the statutory medical loss ratio and results in a federal medical loss ratio that is greater than or equal to the statutory medical loss ratio. Therefore, Kaiser’s projected federal medical loss ratio is 95.3% or greater. While the definitive loss ratio according to the Patient Protection and Affordable Care Act (PPACA) requirements can only be determined after the experience has emerged, the projected federal loss ratio exceeds the federal small group market medical loss ratio standard of 80%, as defined in 45 C.F.R. section 158.120. – Susan E. Pantely, FSA, MAAA, Consulting Actuary, July 31, 2014, Milliman, Inc.
Kaiser is different
Kaiser is the first to admit their integrate health care services are different from the rest of the industry. The Kaiser system may be the primarily reason why they have been to reduce rates in ten of the regions they offer plans and keep rate increases in the other regions and plans to less than 2%.
| Kaiser | HMO | ||||
| Region | Bronze | H.S.A. | Silver | Gold | Platinum |
| 1 | 1.96% | 1.09% | 1.69% | 1.60% | 0.92% |
| 2 | 1.96% | 1.09% | 1.69% | 1.60% | 0.92% |
| 3 | 1.96% | 1.09% | 1.69% | 1.60% | 0.92% |
| 4 | 1.96% | 1.09% | 1.69% | 1.60% | 0.92% |
| 5 | 1.96% | 1.09% | 1.69% | 1.60% | 0.92% |
| 6 | -0.59% | -1.43% | -0.85% | -0.94% | -1.60% |
| 7 | -5.32% | -6.13% | -5.58% | -5.65% | -6.29% |
| 8 | 1.96% | 1.09% | 1.69% | 1.60% | 0.92% |
| 10 | -3.70% | -4.52% | -3.96% | -4.04% | -4.69% |
| 11 | -8.24% | -9.02% | -8.48% | -8.56% | -9.18% |
| 12 | 1.97% | 1.10% | 1.70% | 1.61% | 0.93% |
| 13 | 1.92% | 1.05% | 1.65% | 1.56% | 0.87% |
| 14 | 1.92% | 1.05% | 1.65% | 1.56% | 0.87% |
| 15 | -3.08% | -3.90% | -3.34% | -3.42% | -4.07% |
| 16 | -8.18% | -8.97% | -8.43% | -8.51% | -9.12% |
| 17 | -0.66% | -1.50% | -0.92% | -1.01% | -1.67% |
| 18 | -2.94% | -3.76% | -3.19% | -3.28% | -3.93% |
| 19 | -1.34% | -2.19% | -1.61% | -1.69% | -2.35% |
L.A. Care
L.A. Care only offers HMO plans in the two regions that are within Los Angeles County, Regions 15 and 16. The rate changes are consistent with other plans that have the Silver plan having the least amount of increase relative to Bronze, Gold and Platinum. It’s possible with 59% of the total enrollment in Silver plans through Covered California, that large membership pool is helping to keep revenue high compared to the Silver plan membership claims. Notable is the large percentage increase of their Bronze plans to the Silver plans.
| L.A. Care | HMO | |||
| Region | Bronze | Silver | Gold | Platinum |
| 15 | 12.93% | 3.48% | 9.33% | 10.04% |
| 16 | 12.34% | 3.81% | 9.32% | 9.96% |
Molina
Molina offers plans in Regions 15, 16, 17, and 19 and is fairly consistent with their modest rate increases across plans and regions. They exhibit a trend in Southern California rate increases where the Bronze plans usually have the largest percentage increase. It is challenging for a carrier to offer a HMO in a Bronze metal tier benefits design. Anthem Blue Cross and Health Net don’t even offer Bronze HMO plans instead offering EPO plans in its place in Southern California regions.
| Molina | HMO | |||
| Region | Bronze | Silver | Gold | Platinum |
| 15 | 3.44% | -0.99% | 1.36% | 0.84% |
| 16 | 3.44% | -0.99% | 1.36% | 0.84% |
| 17 | 3.44% | -0.99% | 1.36% | 0.84% |
| 19 | 2.81% | -1.66% | 0.74% | 0.12% |
Sharp Health Plan
Sharp Health Plan only operates in San Diego County. They are unique in that they offer two types of Silver, Gold and Platinum plans designated by HMO 1 and HMO 2. The HMO 1 plan is assigned the Performance network of providers and HMO 2 has the Premier network. An additional differentiation in 2014 was that the HMO 1 plan used a coinsurance percentage to meet the maximum out of pocket amounts while the HMO 2 incorporated set copayment amounts which is more financially advantageous for the member. It’s unclear from either the rate filing or the Covered California material if coinsurance versus copayment design will be carried forward for the Silver, Gold and Platinum plans
| Sharp |
HMO |
|||
| Region | H.S.A | Silver 1 | Gold 1 | Platinum 1 |
| 19 | 4.86% | 2.79% | 3.86% | 5.57% |
| Bronze 2 | Silver 2 | Gold 2 | Platinum 2 | |
| 5.35% | 3.08% | 4.11% | 6.03% | |
Sharp will offer two networks: Premier and Performance, with Premier being the narrower of the two. Sharp is proposing to offer the Premier and Performance networks on the exchange paired with specific plan designs. – Milliman, Inc. actuarial supporting documents
Valley Health Plan
Valley Health Plan (VHP) is a local initiative health plan organized by Santa Clara County. They only operate and offer health plans in Region 7. Their rate increases are modest with the Silver plan being decreased .36%.
| VHP | HMO | |||
| Region | Bronze | Silver | Gold | Platinum |
| 7 | 0.48% | -0.36% | 2.22% | 3.32% |
Western Health Advantage
Western Health Advantage (WHA) is a regional health plan owned by several hospitals and physician groups in Northern California. They offer HMO plans in Regions 2 (Marin, Napa, Solano, and Sonoma counties) and Region 3 (Sacramento, Placer, El Dorado, and Yolo counties.) Like many HMO health plans, the Bronze metal tier has the greatest proposed rate increases of around 4% in both regions. WHA substantially dropped their Silver, Gold and Platinum plans in Region 3 by over 5% each. Oddly enough, Region 3 is where ABC is proposing 15% – 19% rate increases for their HMO plans.
| WHA | HMO | ||||
| Region | Bronze | H.S.A. | Silver | Gold | Platinum |
| 2 | 4.01% | 4.00% | -2.95% | 0.04% | -0.01% |
| 3 | 3.98% | 4.03% | -6.97% | -6.00% | -5.02% |
Covered California 2015 health plans by regions, counties
| 2015 Covered California Health Plan Premium Changes | |||||
| Region 1 | Weighted Average Increase | Range | Region 1 | Counties | |
| ABC PPO | 4.6% | 4% to 8% | Alpine | Amador | Butte |
| BSC EPO | 6.0% | 6.0% | Calaveras | Colusa | Del Norte |
| Kaiser HMO | 1.6% | -4% to 2% | Glenn | Humbolt | Lake |
| Lassen | Mendocino | Modoc | |||
| Nevada | Plumas | Shasta | |||
| Sierra | Siskiyou | Sutter | |||
| Tehama | Trinity | Tuolumne | |||
| Yuba | |||||
| Region 2 | Weighted Average Increase | Range | Region 2 | Counties | |
| ABC PPO | 10.2% | 10% to 13% | Marin | Napa | Solano |
| BSC EPO | 6.0% | 6% | Sonoma | ||
| HN EPO* | 7.2% | 6% to 9% | |||
| Kaiser HMO | 1.7% | -4% to 2% | |||
| WHA HMO | 2.8% | -3% to 4% | |||
| Region 3 | Weighted Average Increase | Range | Region 3 | Counties | |
| ABC PPO | 4.3% | 4% to 7% | Sacramento | Placer | El Dorado |
| ABC HMO | 16.7% | 15% to 19% | Yolo | ||
| BSC PPO | 6.0% | 6% | |||
| Kaiser HMO | 1.7% | -4% to 2% | |||
| WHA HMO | -1.8% | -7% to 4% | |||
| Region 4 | Weighted Average Increase | Range | Region 4 | Counties | |
| ABC EPO | 10.9% | 10% to 14% | San Francisco | ||
| BSC PPO | 6.0% | 6% | |||
| CCHP HMO | 8.9% | 8% to 10% | |||
| HN EPO* | 7.4% | 6% to 9% | |||
| Kaiser HMO | 1.6% | -4% to 2% | |||
| Region 5 | Weighted Average Increase | Range | Region 5 | Counties | |
| ABC PPO | 6.6% | 6% to 9% | Contra Costs | ||
| BSC PPO | 6.0% | 6% | |||
| HN EPO* | 7.2% | 6% to 9% | |||
| Kaiser HMO | 1.7% | -4% to 2% | |||
| Region 6 | Weighted Average Increase | Range | Region 6 | Counties | |
| ABC PPO | 5.2% | 4% to 8% | Alameda | ||
| BSC EPO | 6.0% | 6% | |||
| Kaiser HMO | -0.9% | -7% to -1% | |||
| Region 7 | Weighted Average Increase | Range | Region 7 | Counties | |
| ABC PPO | 1.5% | 1% to 4% | Santa Clara | ||
| ABC HMO | 6.4% | 6% to 10% | |||
| BSC PPO | 6.0% | 6% | |||
| HN EPO* | 7.5% | 6% to 9% | |||
| Kaiser HMO | -5.6% | -11% to -5% | |||
| VHP HMO | 0.4% | 0% to 3% | |||
| Region 8 | Weighted Average Increase | Range | Region 8 | Counties | |
| ABC PPO | 1.5% | 1% to 4% | San Mateo | ||
| BSC PPO | 6.0% | 6% | |||
| CCHP HMO | 8.9% | 8% to 10% | |||
| HN EPO* | 7.5% | 6% to 9% | |||
| Kaiser HMO | 1.7% | -4% to 2% | |||
| Region 9 | Weighted Average Increase | Range | Region 9 | Counties | |
| ABC PPO | 90.0% | 0% to 4% | Monterey | San Benito | Santa Cruz |
| BSC EPO | 6.0% | 6% | |||
| HN EPO* | 7.1% | 6% to 9% | |||
| Region 10 | Weighted Average Increase | Range | Region 10 | Counties | |
| ABC PPO | -2.9% | -3% to 0% | San Joaquin | Stanislaus | Merced |
| BSC PPO | 6.0% | 6% | Mariposa | Tulare | |
| HN EPO* | 7.3% | 6% to 9% | |||
| Kaiser HMO | -4.0% | -10% to -4% | |||
| Region 11 | Weighted Average Increase | Range | Region 11 | Counties | |
| ABC PPO | 3.7% | 3% to 8% | Fresno | Kings | Madera |
| ABC HMO | 6.5% | 6% to 9% | |||
| BSC PPO | 6.0% | 6% to 9% | |||
| Kaiser HMO | -8.5% | -14% to -8% | |||
| Region 12 | Weighted Average Increase | Range | Region 12 | Counties | |
| ABC PPO | 4.9% | 4% to 8% | San Luis Obispo | Santa Barbara | Ventura |
| BSC PPO | 6.0% | 6% | |||
| Kaiser HMO | 1.7% | -4% to 2% | |||
| Region 13 | Weighted Average Increase | Range | Region 13 | Counties | |
| ABC PPO | 1.3% | 1% to 4% | Mono | Inyo | Imperial |
| BSC PPO | 6.0% | 6% | |||
| Kaiser HMO | 1.6% | -4% to 2% | |||
| Region 14 | Weighted Average Increase | Range | Region 14 | Counties | |
| ABC PPO | 3.0% | 2% to 6% | Kern | ||
| BSC PPO | 6.0% | 6% | |||
| HN EPO* | 7.7% | 6% to 9% | |||
| Kaiser HMO | 1.6% | -4% to 2% | |||
| Region 15 | Weighted Average Increase | Range | Region 15 | Counties | |
| ABC EPO | 8.0% | 7% to 11% | Los Angeles | ||
| ABC HMO | 0.3% | 0% to 3% | |||
| BSC PPO | 6.0% | 6% | |||
| HN HMO | 2.8% | 2% to 3% | |||
| HN EPO* | 7.9% | 7% to 9% | |||
| Kaiser HMO | -3.4% | -9% to -3% | |||
| LAC HMO | 11.0% | 4% to 15% | |||
| Molina HMO | 2.7% | -1% to 4% | |||
| Region 16 | Weighted Average Increase | Range | Region 16 | ||
| ABC EPO | 12.5% | 11% to 16% | Los Angeles | ||
| ABC HMO | 3.4% | 3% to 6% | |||
| BSC PPO | 6.0% | 6% | |||
| HN HMO | 0.9% | 0% to 1% | |||
| HN EPO* | 8.4% | 7% to 9% | |||
| Kaiser HMO | -8.5% | -14% to 8% | |||
| LAC HMO | 11.5% | 4% to 15% | |||
| Molina HMO | 3.0% | -1% to 4% | |||
| Region 17 | Weighted Average Increase | Range | Region 17 | Counties | |
| ABC EPO | 8.0% | 7% to 11% | San Bernardino | Riverside | |
| ABC HMO | 5.3% | 5% to 8% | |||
| BSC PPO | 6.0% | 6% | |||
| HN HMO | 4.8% | 4% to 9% | |||
| HN EPO* | 8.0% | 7% to 9% | |||
| Kaiser HMO | -1.0% | -7% to -1% | |||
| Molina HMO | 3.1% | -1% to 4% | |||
| Region 18 | Weighted Average Increase | Range | Region 18 | Counties | |
| ABC EPO | 5.7% | 5% – 9% | Orange | ||
| ABC HMO | 6.7% | 6% – 9% | |||
| BSC PPO | 6.0% | 6% | |||
| HN HMO | 9.3% | 8% to 9% | |||
| HN EPO* | 8.4% | 7% to 9% | |||
| Kaiser HMO | -3.3% | -9% to -3% | |||
| Region 19 | Weighted Average | Range | Region 19 | Counties | |
| ABC EPO | 7.8% | 7% to 11% | San Diego | ||
| ABC HMO | 7.3% | 7% to 10% | |||
| BSC PPO | 6.0% | 6% | |||
| HN HMO | 8.7% | 7% to 9% | |||
| HN EPO* | 8.5% | 7% to 9% | |||
| Kaiser HMO | -1.6% | -7% to -1% | |||
| Molina HMO | 0.6% | -2% to 3.7% | |||
| Sharp Coin. | 4.8% | 3% to 7% | |||
| Sharp Copay | 3.5% | 3% to 6% | |||
*Indicates EPO is a new plan replacing current PPO plan.
DMHC PDF Pipeline
For plans that have their rates reviewed by the Department of Managed Health Care, one of the documents they file is called the Initial PDF Pipeline. This document usually contains the majority of supporting documents filed to justify the health plans rate changes. Some carriers will also include an image of the spreadsheets they file separately that can be found on the DMHC rate filing website. The HN_CDI folder contains some the documents Health Net file with the California Department of Insurance to justify their rates for their new EPO plans. [wpfilebase tag=browser id=28 /]
ABC = Anthem Blue Cross
BSC = Blue Shield of California
CCHP = Chinese Community Health Plan
HN = Health Net
VHP = Valley Health Plan
WHA = Western Health Advantage