

Winners and loser of market share in the Covered California insurance exchange.
As Covered California enters its sixth year as a market place for individual and family health insurance, we can see how the market share of the different health plans has changed over the years. The big winners are Blue Shield of California and Kaiser Permanente, who, combined, command almost 2/3 of all enrollments through Covered California. The change in market share between the different carriers participating in Covered California is a function of price, service area, and external factors such as other off-exchange plans.
It is estimated that Covered California handles over half of all individual and family plans sold in the state. They have been holding steady at approximately 1.3 million enrolled individuals. In the early years of Covered California many people were hesitant to get involved in Covered California, even if they knew they qualified for the premium tax credit subsidy. But as rates have continued to rise, often at double-digit percentages, many people set aside their concerns and enrolled in Covered California to lower their monthly health insurance premiums.
California has 19 different rating regions. Only Blue Cross and Blue Shield have ever serviced most of the entire state. Many of the health plans, such L. A. Care, Sharp, and Valley Health Plan, only serve one county. A few other health plans like Molina, Oscar, and Western Health Advantage serve 3 or 4 counties. While Kaiser has a presence in all regions, they may only serve a hand full of zip codes in some regions limiting their service area.
Carrier’s Market Share Evolves Over Time

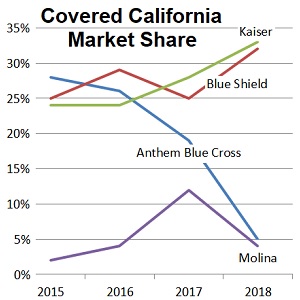
Graph of health plan’s market share percentage in Covered California 2015 through 2018.
For the most part, the regions served by all the health plans have remained somewhat stable with a few exceptions. The service area of the health plan loosely corresponds to its market share in Covered California. Sharp only serves San Diego County and Valley Health Plan only serves Santa Clara County. While those are populous counties, it would be hard for either carrier to garner more than single digits of market share.

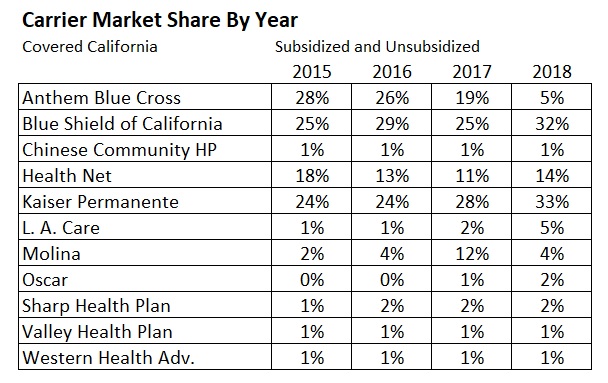
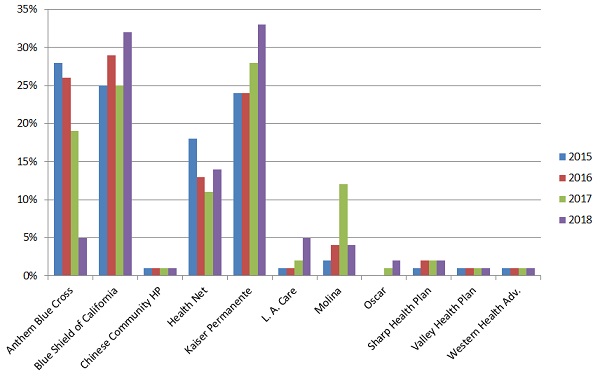
Carrier market share percentage in Covered California from 2015 to 2018.
Anthem Blue Cross started out as carrier with the largest enrollments in 2014 and 2015. They dropped to 26% market share in 2016. They dropped again 2017 down to 19%. Part of the drop, from my perspective, was related to the cost of the health plan versus their EPO network. People didn’t see the value of the smaller network and no out of network coverage relative to other alternatives. Then in 2018 Blue Cross pulled out of most of California. They offered plans only in region 1 (Northern California), region 7 (Santa Clara County) and region 10 (Central Valley counties). This dropped their market share down to 5%.
Blue Shield was the recipient of market share increase where Blue Cross had left. They increased their market share from 25% in 2017 to 32% in 2018. The Blue Shield PPO rates are some of the highest in the state. Even a substantial tax credit through Covered California can still make the Blue Shield plans several hundred dollars more than a similar HMO plan. Blue Shield has introduced and expanded the service are of their Trio HMO plans, but enrollments in those HMO plans don’t account for the increase in market share in 2018. One popular aspect of Blue Shield in 2018 was the BlueCard program that let members see out of state doctors at in-network rates. This feature is going away in 2019, so that may erode some Blue Shield loyalty.
Health Net started off strong with an 18% market share by 2015. They slid down to 13% and 11% in years 2016 and 2017. They were able to grab a little more of the market in 2018 at 14%. Mostly likely this is a result of Anthem Blue Cross leaving Southern California in 2018. While most plans have tinkered with their network structure, most have continued to be either EPO, HMO, or PPO plans in their portfolio. Health Net can’t be identified with any plan type. They offer HMOs, HSPs, EPOs, and PPO plans in different regions of the state. This makes it hard for the consumer to develop a brand identity for Health Net. In addition, their rates don’t seem to be consistent from year to year. Sometimes they are the low price leader, and then the next year they are the highest. Health Net does offer a popular full network PPO that is only offered off-exchange.
Kaiser has been steadily increasing their market share. With the exception for expanding their service area in the Santa Cruz and Monterey region, their footprint has not changed much since 2014. Kaiser in Northern California tends to have lowest rates where they offer coverage. While carriers like Chinese Community HP, Valley Health Plan, and Western Health Advantage are very competitive with Kaiser in local regions, Kaiser members are pretty loyal. In Southern California, there is more competition and Kaiser is usually in the middle of the pack for rates. But here again, loyalty to Kaiser helps maintain their market share.
In 2018 they had 33% of the market through Covered California and really only serviced 2/3 of the state. But they are located in dense urban areas that contain most to the state’s population. In 2015 Kaiser had 24% of the market. To increase it to 33% lends credence to their stability and consistency. People either love Kaiser or they don’t. I do know people who don’t like Kaiser, but decided to enroll with them just because of the lower rates, and possibly, and even greater distaste for the competition.
L. A. Care increased their market share by over 100% between 2017 and 2018. They went from 2% to 5% and they only serve Los Angeles County. Part of the big gain may have been at the expense of Molina who dropped from 12% in 2017 to 4% in 2018. That was mostly a result of steep price increases for the 2018 plan year. Consumers left Molina in droves not seeing the value in the HMO with double-digit rate increases for health insurance they rarely used. The Molina exodus of 2018 also helped Health Net who was offering their HMO plans in the some of the same regions.
Oscar health insurance jumped from 1% to 2% between 2017 and 2018. They also expanded their service area into San Francisco County in Northern California. Their rates are competitive and Oscar will probably continue to siphon away business from some of the other EPO and PPO consumers. They also have changed their rates little for 2019, putting them in an even better competitive situation.
The regional health plans of Chinese Community HP, Sharp, Valley Health Plan, and Western Health Advantage have all been stable hovering around 1% to 2% market share. Sharp will have some hefty rate increases in 2019 so they might see their market share drop in San Diego County.
Off-Exchange Plans & Enrollment
In 2014, 2015 and 2016 there were health plans offered by Assurant and Cigna. Those carriers, who only offered off-exchange plans, left the market. Sutter Health Plus started offering their HMO plans in the Sacramento and Bay Areas in 2016. These plans are only offered off-exchange. Sutter has many popular medical groups and hospitals in their network. For consumers who earn too much to qualify for the Covered California subsidy, Sutter is an increasingly popular option.
Several of the carriers also offer off-exchange non-standard benefit health plans not allowed on the Covered California exchange. These plans are usually less expensive compared to similar standard metal tier plans offered through Covered California and off-exchange. Up until 2018, all the standard metal tier plans offered through Covered California were also sold at the exact same rate off-exchange direct from the carriers. This meant that Covered California had somewhat of a competitive advantage because the rates were the same and they offered the subsidy assistance.
Artificially Inflated Silver Rates
In 2018 the Trump administration pulled the plug on the Silver plans cost-sharing reduction subsidy. In order to fund the cost-sharing reductions for the Enhanced Silver plans 73, 87, and 94, Covered California had all the carriers raise the rates on their Silver plans to cover for the loss of federal dollars. This artificially inflated the Silver plans. Covered California members who received very little or no tax credit subsidy were directed to off-exchange Silver 70 plans – which were virtually identical to the Covered California plan – at a savings of 10% to 12% over the exchange market rate.
The result was a small percentage, probably less than 1%, of Covered California consumers went off-exchange. Because the premium tax credit subsidy is based on the second lowest cost Silver plan, most Covered California consumers were insulated from the artificially inflated Silver plan rates. Since over 95% of consumers get tax credits in Covered California, many of the rate increases, so burdensome to off-exchange consumers, don’t register with Covered California members. Many people had their rates go down in 2018 because the increase in the second lowest cost Silver plan (artificially inflated) was greater than their own health plan’s increase for inflation and age adjustment.
Metal Tier Plan Enrollment Percentages
The Silver plan surcharge to cover the cost-sharing reduction funds actually shifted metal tier enrollment. Silver plan enrollment had been running at between 62% and 64% through 2017. In 2018, because of the Silver plan rate surcharge, some Gold plans were the same cost or lower. Silver plan enrollment dropped to 56% in 2018, while Gold enrollment jumped from 5% to 10%. There was also a slight uptick in Platinum enrollments, which had been declining in recent years. The Bronze plans also saw an increase in enrollments in 2018. This was mainly a function of the subsidy increasing so much for some people; it made the Bronze plans less than $10 per month.

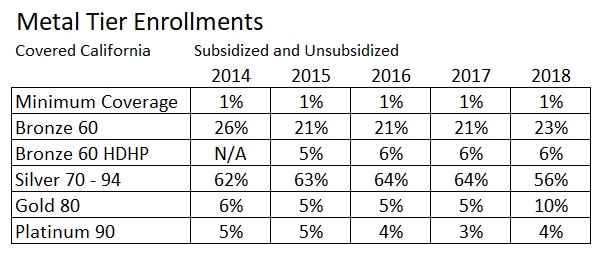
Changes to metal tier plan enrollment through Covered California for plan years 2014 through 2018.
Covered California touts itself as one of the most stable market places in the United States for individual and family health insurance. And they are correct. Both the rate increases and enrollments have been steady. Most of the movement in market share for the carriers has been mainly self-inflicted. Anthem Blue Cross decreases are a direct result of leaving most of regions in the state.
Health Net has tried to be so specific with plans in different service areas that consumers aren’t really sure who they are. Is Health Net an HMO or a PPO? It all depends on where you live. Molina gained market share with great rates and then over corrected in 2018 and lost over half their members. Blue Shield and Kaiser, for all their faults; have kept their product offerings, on and off the exchange, simple. They have not tried to be all things to all people. This consistency goes along way with consumers and agents like me who have to try and stay knowledgeable about 12 health insurance carriers in California for individuals and families.
All the data above comes from the Covered California rate and plan booklets issued every year. Opinions expressed in this post are those of Kevin Knauss.
2019 Covered California Plans Rates Book
2019 Individual and Family Health Plans and Rate Increases in California.
CoveredCA_2018_Plans_and_Rates_8-1-2017
Covered California rate book for plans offered in the 19 different regions of the state by age for 2018