


My Covered California clients would lose an average of $157 per month to help pay for their health insurance under the March, 2017, Trumpcare proposal.
In order determine how my clients might be affected by the proposed new Premium Tax Credits under the American Heath Care Act (AHCA or Trumpcare) introduced by the Republicans in March 2017, I compared the current income based Premium Tax Credits under the ACA to the new age based tax credits of the AHCA. On average, my clients included in the comparison will lose $157 per month to help pay for their health insurance. Young individuals, under 30 years old, have the smallest change of premium tax credit under the age based rules. Within my clients, people over 55 year old will get hit the hardest losing $200 to $400 per month in premium tax credit assistance.
Trumpcare Would Cut My Clients Subsidy
The total monthly amount of Obamacare tax credit my survey group is receiving equals $26,906. The tax credits this group would receive under the new age based rules (Trumpcare) would be $17,282; a net loss of $9,624 per month. The current ACA Obamacare monthly tax credit is based on the making the Second Lowest Cost Silver Plan in the region affordable to the household’s Modified Adjusted Gross Income. This ties the tax credit not only to the household’s monthly income, but also adjusts the subsidy to a region’s health insurance premiums. The proposed Trumpcare bases the tax credit subsidy solely on the age of the individual and does not account for regional differences in health insurance premium. In California alone, Northern California health insurance rates can be 10% to 15% higher on average than Southern California Rates. See How Are Health Insurance Rate Determined?

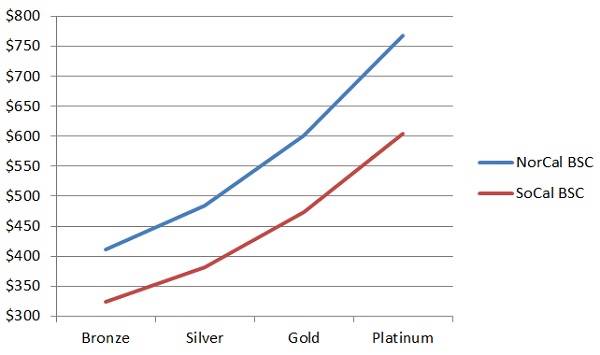
Blue Shield of California rates for a 40 year old enrolling in a PPO plan. The blue line represent the higher rates for the same metal tier plan in San Francisco. The red line is the lower rates for Region 16 in Los Angeles County.
Of the 62 individuals surveyed from my client base that are enrolled through Covered California and receiving the monthly APTC subsidy, 14 of them would receive a higher monthly tax credit under the new AHCA age based formula. A few people would see an increase of the monthly tax of over $120 per month. Most of those individuals that could receive an increase in the monthly subsidy are under 50 years old. The average increase would be $68 per month. See the full table of data at end of post.
Average Loss Of $157 Per Month
The other 47 individuals would realize an average net loss of $157 per month. 25 of these Covered California members would see a decrease of over $200 per month. Two of the individuals would lose over $500 per month to help pay for their health insurance. 27 of the clients reviewed were also receiving Cost Sharing Reductions (CSR) in association with enhanced Silver plans 73, 87, and 94. Under the proposed AHCA these Cost Sharing Reductions, which lower the deductible, copayments, and maximum out-of-pocket amounts, would also be phased out. This means that not only will the monthly premiums increase; many people will lose the extra help that reduces the actual cost of the health care.
New 5 to 1 Age Rate Ratio
Another penalty that would be leveled against my older clients is the proposed Trumpcare premium to age ratio. Currently, Obamacare limits the highest monthly health insurance premium that can be charge of a 64 year to no more than three times that of a young adult. This is a 3:1 ratio. Under the Trumpcare the ratio would be raised to 5:1. Today, if a health plan’s rate for a 20 year old is $200, the maximum a 64 year old would pay would be $600. Under the new rules the 64 year old rate could jump to $1,000. Because the ACA Premium Tax Credit formula is tied to the Second Lowest Silver Plan, even if rates jump, eligible members will receive some protection with an increase in the Premium Tax Credit to keep the SLCSP affordable. There is no such mechanism in the proposed Trumpcare.
Because the AHCA is being considered under congressional budget reconciliation rules, the proposed legislation can only address ACA issues such as taxes and expenditures. This means that the essential health benefits included in Obamacare will stay intact. Because the plans must cover essentially the same benefits, it is unlikely that health insurance premiums will be reduced. Additional legislation to amend and reduce the mandated benefits of tax credit eligible plans would have to be introduced. So if the health plan premiums can’t be lowered because they have fewer benefits, most individuals and families will be paying more for their insurance because of the lower tax credits offered through the AHCA.
Families With Children Might Get Higher Tax Credit
If there is any bright spot it is for families. Households that have lots of children could see a net increase in their monthly subsidy. I have one family comprised of three children under 10 years old and the parents are ages 40 and 48. There current APTC subsidy is $900 per month. Under the AHCA it would increase to $1,001 per month under the proposed age based rates. Each adult would receive $250 per month and each child $167 per month. Under the current ACA subsidy formula, this particular family’s subsidy is reduced because they are relatively high wage earners.
As a California health insurance agent I assist individuals and families with enrollment into health plans through Covered California and directly with insurance companies known as off-exchange plans. Most of my clients are in the Bay Area and Southern California. For my clients who are enrolled through Covered California, I can see their age and the monthly Advance Premium Tax Credit (APTC) they are receiving every month through my Covered California account.
However, not everyone in Covered California is either receiving the APTC or may not be receiving their full amount. Some people have opted not to receive the APTC because they won’t know their final income until they do their federal income taxes. They have elected to determine if they are eligible for any Premium Tax Credit when they file their taxes. Other people have selected Bronze plans where their allowed APTC is greater than the monthly insurance premium. Consequently, they aren’t realizing the full PTC they might be entitled to. I also have clients who could qualify for the APTC but have opted not to purchase health insurance through the exchange.
Covered California does not provide the exact APTC per person for families unless family members enroll in different plans. I selected clients where I could easily identify the actual APTC attributable to each individual. Consequently, I did not include multi-member households with a large age difference. For example, if you have a two person household where each adult is the same age, then you can split the APTC in half and attribute 50% to each individual. But if the household has three children, one parent who is 39 and another who is 45, it is difficult to assign fractions of the APTC to each member.
I started at the beginning of the alphabet and just went down my Covered California Client list. I did not sort the list based on location. If the account had members where I could discern the APTC by age, I included them in the list. I will say that my clients tend to be older by virtue of the type of marketing I do for my services. People find me through internet searches, read what I have written about health insurance, then call me if they are interested in my assistance with enrollment. My clients tend to be older professionals, self-employed, who like to read and research about their health insurance options. Because they are mainly self-employed or retired on a fixed income, they generally qualify for larger tax credits.
My survey of average APTC subsidy comparison is not scientific. It is a sampling of my clients that I believe is representational. There is inherent bias because my clients tend to be older with fewer dependents. However, there is no disputing that some individuals by virtue of their age, current income, and where they live will be adversely affected by age based tax credits under the proposed Trumpcare. Individuals and families residing in areas where the health insurance premiums are relatively lower, Southern California, will feel less of a sting from the reduced subsidies under the Trumpcare than if they resided in Northern California where the rates are higher.
Overall, I think my survey and comparison of subsidy differences will mirror what Covered California members will realize. I can say with a high degree of certainty that all older adults of moderate to lower incomes would see their health insurance rates increase if the Trumpcare becomes law.
Reference Material

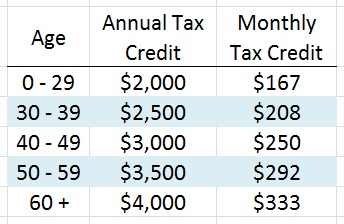
Proposed Trumpcare age based tax credits.
Kaiser Health New
Insurance Journal
[wpfilebase tag=file id=2126 /]
[wpfilebase tag=file id=2127 /]
Individual Obamacare vs Trumpcare Monthly Premium Tax Credits (PTC)
| Age | CSR | Obamacare PTC | Trumpcare PTC | Difference |
| 20 | $187 | $167 | -$20 | |
| 20 | $65 | $197 | $132 | |
| 25 | $200 | $167 | -$33 | |
| 25 | $150 | $167 | $17 | |
| 26 | Y | $176 | $167 | -$9 |
| 28 | $43 | $167 | $124 | |
| 34 | Y | $111 | $208 | $97 |
| 39 | Y | $152 | $208 | $56 |
| 39 | Y | $338 | $208 | -$130 |
| 39 | $250 | $208 | -$42 | |
| 40 | Y | $244 | $250 | $6 |
| 41 | $200 | $250 | $50 | |
| 45 | $310 | $250 | -$60 | |
| 45 | Y | $200 | $250 | $50 |
| 46 | $123 | $250 | $127 | |
| 47 | $375 | $250 | -$125 | |
| 49 | $290 | $250 | -$40 | |
| 50 | Y | $522 | $292 | -$230 |
| 50 | $203 | $292 | $89 | |
| 51 | Y | $254 | $292 | $38 |
| 51 | $300 | $292 | -$8 | |
| 51 | $475 | $292 | -$183 | |
| 52 | Y | $377 | $292 | -$85 |
| 52 | Y | $377 | $292 | -$85 |
| 53 | $350 | $292 | -$58 | |
| 53 | Y | $564 | $292 | -$272 |
| 54 | $435 | $292 | -$143 | |
| 54 | $200 | $292 | $92 | |
| 55 | $619 | $292 | -$327 | |
| 55 | Y | $467 | $292 | -$175 |
| 55 | $653 | $292 | -$361 | |
| 55 | $500 | $292 | -$208 | |
| 55 | $500 | $292 | -$208 | |
| 56 | $475 | $292 | -$183 | |
| 57 | $569 | $292 | -$277 | |
| 57 | Y | $377 | $292 | -$85 |
| 58 | $508 | $292 | -$216 | |
| 59 | Y | $486 | $292 | -$194 |
| 59 | Y | $750 | $292 | -$458 |
| 59 | Y | $584 | $292 | -$292 |
| 59 | Y | $548 | $292 | -$256 |
| 60 | Y | $607 | $333 | -$274 |
| 60 | $500 | $333 | -$167 | |
| 60 | Y | $317 | $333 | $16 |
| 60 | $400 | $333 | -$67 | |
| 60 | Y | $798 | $333 | -$465 |
| 60 | Y | $734 | $333 | -$401 |
| 60 | $600 | $333 | -$267 | |
| 61 | $387 | $333 | -$54 | |
| 61 | $731 | $333 | -$398 | |
| 62 | $655 | $333 | -$322 | |
| 62 | $528 | $333 | -$195 | |
| 62 | $731 | $333 | -$398 | |
| 62 | $266 | $333 | $67 | |
| 63 | Y | $570 | $333 | -$237 |
| 63 | Y | $570 | $333 | -$237 |
| 64 | Y | $897 | $333 | -$564 |
| 64 | $683 | $333 | -$350 | |
| 64 | Y | $750 | $333 | -$417 |
| 64 | Y | $958 | $333 | -$625 |
| 64 | Y | $717 | $333 | -$384 |
| $26,906 | $17,282 | -$9,624 | ||
| Average | -$157 |