

With the impending drought in California we are long over due for a residential water rate restructuring. No longer can we continue to price water based on water district’s budgets to meet their financial goals. We need a reality based seasonally adjusted water rate structure model that should be based on a consumer’s lot size, home type and the specific climate of the region. Such a rate structure would give homeowners and irrigation managers a benchmark on how much water they should be using and real incentives to conserve.
Most water rates don’t encourage conservation
Unless the water district has taken a strong position to induce conservation based on price, most rate structures rarely penalize excess consumption. (See: Water rates discourage conservation) Consequently, those people who really do conserve are rarely rewarded for their efforts. The question of what is “excess consumption” over and above the minimum amount of water needed for healthy residents and landscapes is at the core for a new rate structure based on reality. A real world water rate structure would be the combination water necessary to keep the landscape healthy plus average household use. (One of the better rate structures for conservation is the Marin Municipal Water District which has a tier four that is six times higher than the tier one. Unlike my district that reduces the price as I use more water.)
Water rates based on budgets, not conservation
In Northern California most water districts create tiered rate structures to cover their fixed costs and variable costs of operation. The fixed costs are generally represented in the daily base charge to the consumer. This fixed amount never changes regardless of how much water is used. The daily rate covers the infrastructure and maintenance costs to treat and deliver the water. Costs such as administration, water main repair, electricity and fixed costs associated with treating surface water.
Is there a price component for conservation?
The metered rate loosely translates into the costs of acquiring and treating additional water to meet demand. Additional energy is required to treat and pump water which is recaptured with metered rates. Many districts or utilities will have a tiered water rate structure for their metered customers. As more water is used, the consumer pays a higher price per unit as they move into higher pricing tiers. It is incumbent upon each water district to determine how much of a price increase or premium they want to build into the price of the water to encourage conservation after recapturing their variable costs to deliver the water.
How much irrigation water is too much?
Excess consumption is any amount of water used above the necessary amount to keep a residence’s landscaping healthy and meets the needs of the potential number of occupants for the house size. A new rate structure would have the cost of water above the determined healthy minimum amount for the residence double or triple in cost. Conversely, water usage below the healthy amount would be rewarded with lower rates for conservation. Property owners need a real world benchmark of how much water they should be using given the size of their house and local climate conditions.
Over production of water is wasted
Currently, other than historical averages, water districts have no measurement of how much water they should be producing to keep the community healthy. What is obvious with the current drought restrictions is that, on average, water districts are producing far more water than is necessary to meet the minimum healthy requirement for the community. In other words, some people are using more water than they really need and the additional cost of the water doesn’t create an imperative for the consumer to conserve.
Seasonally adjusted water rate model
A new seasonally adjusted water rate model would take into consideration the available land each parcel has to be irrigated. Residential landscape irrigation is traditionally the largest consumer of treated suburban water. Each residential parcel is comprised of impervious hardscapes that can’t be irrigated such as the house, sidewalks, decks and driveways. The land that can be irrigated would be subject to historical evapotranspiration rates for determining how much water would be allotted at a fair rate to keep the landscape healthy
GIS tools to help consumers and districts
While it would be no small undertaking, new geospatial programs can determine how much of a residential parcel is available for irrigation. Geographical information systems (GIS) can combine satellite images with specific parcel information (e.g., lot size, house size, water district, ET area, etc.) to determine how much area is available to be irrigated. GIS systems are already be used by local and state governments to catalog and evaluate a variety topics in our communities.


Healthy landscape irrigation minimums
Once a district has the actual acreage available to be irrigated for a specific parcel, they can simply apply well established monthly evapotranspiration (ET) rates in California and then assign the amount of water necessary to keep the landscape healthy. (What is evapotranspiration rate?) It is a fairly straight forward set of calculations to determine the appropriate amount of water necessary

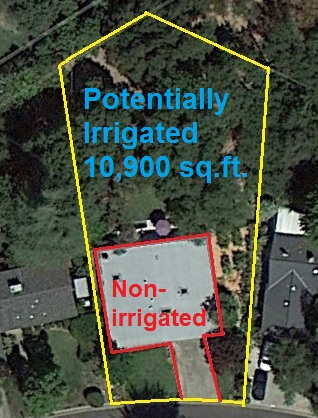
GIS could be used to determine how much of a lot is landscape.
to keep a landscape healthy. The ET water map developed by the Department of Water Resources (DWR) gives historical amounts of water for a variety of climates in California. (View ET map at end of post) It’s then a matter of crunching the numbers to arrive at the minimum necessary amount of water and then convert that into a district’s billing unit which is Hundred Cubic Feet (CCF). 1 CCF = 748 gallons.
Real world example of seasonally adjusted water requirements
In this real world example, we have a .32 of acre residential lot located in DWR’s ET zone 14. The house and drive way comprise 3,350 square feet of hard surface that can’t be irrigated. That leaves approximately 10,900 square feet of landscape area that could be irrigated. To determine a seasonally adjusted water rate structure for the parcel we just use the the ET water depth, multiplied by the square feet of the landscape to get a volume of water that can be converted into the standard billable CCF.
10,900 ft2 in ET zone 14
| ET inches/month | Gallons | CCF | |
| Jan. | 1.55 | 10531 | 14.08 |
| Feb. | 2.24 | 15219 | 20.35 |
| Mar. | 3.72 | 25275 | 33.79 |
| April | 5.10 | 34651 | 46.33 |
| May | 6.82 | 46337 | 61.95 |
| June | 7.80 | 52996 | 70.85 |
| July | 8.68 | 58975 | 78.84 |
| August | 7.75 | 52656 | 70.40 |
| Sept. | 5.70 | 38728 | 51.78 |
| Oct. | 4.03 | 27381 | 36.61 |
| Nov. | 2.10 | 14268 | 19.08 |
| Dec. | 1.55 | 10531 | 14.08 |
| (ET in./12″/ft.) x (Area square feet) = cubic feet | |||
| 1 cubic foot equals 7.48 gallons | |||
| Hundred Cubic Foot (CCF) = 748 gallons | |||
Non-penalized water use with seasonal changes
As the ET rate increases, the homeowner is allotted more units of water to meet their landscape irrigation needs without penalty of moving into a higher tier. As the weather cools, and if the homeowner fails to adjust the irrigation systems thereby using more water than is seasonally necessary, the water bill would reflect a higher cost per unit over the targeted consumption point. The water district could include a buffer of 5% to 10% on either side of target amount and also adjust the ET to reflect water rates favoring drought tolerant plants.
Water rates tied to seasonal demand
The new reality based seasonally adjusted water rate structure would float during the year. The lower tiers would reflect a lower rate for those homeowners who conserved water below their seasonally adjusted amount. The seasonal target tier, which would increase and decrease during the year, would be that rate encompassing the targeted water use for the landscape size and reflect a water price that covers the district’s variable costs of delivering the water. The highest tier would be water usage above the seasonally adjusted benchmark amount and would have a price of double or triple the target tier as a means of inducing conservation.
Homeowner water use benchmark
While the rate or price of each tier would be the same through out the district, each residential lot would have specific water amounts associated with each tier. It wouldn’t be how much much was used, but how much water was used in relation to the specific lot’s given landscape and house size as measured by the geo-spatial analysis. Instead of tiers based on arbitrarily fixed unit amounts by the water district it would be tiers based the estimated water necessary to meet a health landscape and household throughout the year.
Flushing toilets and washing dishes
Similar to the landscape being assigned a “healthy” minimum water amount, the house would also be allotted a certain amount of water units. A larger house with more bedrooms and bathrooms would be accorded a higher water usage in the normal range. A five bedroom house would be allowed more water in the household tier than a house with only two bedrooms. In this example we have a 3 bedroom, two bath house. It can comfortably accommodate 6 individuals that might use 150 gallons of water per day.
| Seasonally Adjusted Minimum CCF Water Use | |||
| Household | Landscape | Target | |
| Jan. | 36.10 | 14.08 | 50.18 |
| Feb. | 36.10 | 20.35 | 56.45 |
| Mar. | 36.10 | 33.79 | 69.89 |
| April | 36.10 | 46.33 | 82.43 |
| May | 36.10 | 61.95 | 98.05 |
| June | 36.10 | 70.85 | 106.95 |
| July | 36.10 | 78.84 | 114.94 |
| August | 36.10 | 70.40 | 106.50 |
| Sept. | 36.10 | 51.78 | 87.88 |
| Oct. | 36.10 | 36.61 | 72.71 |
| Nov. | 36.10 | 19.08 | 55.18 |
| Dec. | 36.10 | 14.08 | 50.18 |
| 150 gallons per person per day | |||
| 4,500 gallons per person per month | |||
| 6.02 CCF units per person per month | |||
| CCF = 748 gallons | |||
| 6 person household = 36.10 CCF per month | |||
Rewarding efficient use of water
The new reality based rate structure wouldn’t stop people from using as much water as they like. It would just place a more realistic pricing mechanism on the water that is used. A large family with a large lot shouldn’t be penalized for their water consumption anymore than a small house on a small lot that over irrigates should be rewarded for wasting water by having a virtually similar water bill as the large house on a large lot. For example, in the above illustration any CCF water unit over the monthly target amount might be priced double or triple that of the seasonally adjusted targeted rate amount. The lowest tiered pricing rate would encompass the estimated minimum amount of just household water use.
Helping consumers save water with realistic estimates
Individuals and families that purposefully and actively conserve water through their household habits, improving their irrigation systems and planting drought tolerant plants should be rewarded for their efforts. A reality based water structure that pegs water consumption and pricing to potential water usage based on similar lot and house size gives consumers a benchmark for conserving water.
Variable water rate structure
In this example of a water rate structure based on house and lot size there are two parcels for the month of July in ET zone 14. Lot A is a three bed room, two bath house with 10,900 ft2 of landscape. Lot B is a two bedroom, two bath house with only 5,450 ft2 of landscape. Tier 1 represents the potential minimum amount of water for the average number of residents in the house, six for Lot A and four for Lot B. Tier 2 is the water amount to meet the household plus the landscaping. Tier 3 represents the cost of water units above what should normally be used for the number of residents and the amount of water necessary to keep the landscape healthy. Tier 3 is three times more expensive than tier 2 to encourage proper water management in the home and landscaping.
| CCF Units per tier | |||
| Tier 1 | Tier 2 | Tier 3 | |
| Lot A | 37 | 38 – 115 | 116+ |
| Lot B | 24 | 25 – 64 | 65+ |
| Price | $2/unit | $3/unit | $9/unit |
A water district could include a tier 1.5 that rewards landscape irrigation conservation efforts or a 2.5 tier as a means of alerting consumers they are nearing excessive water use for their parcel.
Rewarding real water conservation
Frankly, I get a little miffed when my water district, who doesn’t reward water conservation in their rate structure, tells me to conserve water. Heck, I’ve been conserving water for 10 years by improving my irrigation system, reducing the amount of turf being watered and upgrading to low flow faucets, appliances and shower heads. The water rate schedules of most districts let large water wasters cut their use by 20% under mandated restrictions but based on their landscape and house size, they may still be wasting water. Real water conservation is using less than what would be expected given the house and lot size.
Billing cycles muddy the water
One issue that will present a challenge is the billing cycle of the water districts. Because water districts must still go out in the neighborhood to read each individual meter, establishing a monthly rate schedule when billing cycles usually span two months creates a meter-reading problem. But there is no reason that the district couldn’t blend the historical rates into their billing cycle since the monthly ET rates are easily converted into daily rates.
Billing cycles cover up conservation
The seasonally adjusted water rate structure would also address the inherent problem with arbitrary billing cycles. Long billing cycles allow the consumer to have their water consumption pushed into higher tier rates, even if they are actively conserving water. Conversely, short billing cycles where the meter might be read every month, has water wasters always being billed at the lower consumption and lower priced tier water rates. With a seasonally adjusted reality based water rate structure it wouldn’t matter if the billing cycle was one week or three months because water usage would always be measured against a healthy minimum water allotment model.
Parks and schools can transition easily to new rate model
Perhaps the easiest application of a new seasonally adjusted water rate model would be with municipal parks and schools. These facilities with their large expanse of turf could be easily adapted to water pricing based on ET rates. You wouldn’t even need geospatial software to determine the size of the irrigated area. All you have to do is open up Google Earth and measure the fields to determine the square feet and then apply the ET rates.
Market based conservation reform
My reality based water rate structure is just a starting point for a discussion on water pricing reform. It is far more complicated than the arbitrary flat rate tiered structures we have today. The current rates are about keeping the water district in business, not necessarily about conservation. A similar pricing model could easily be adapted to agricultural operations. With irrigation controllers that estimate ET and adjust water run times accordingly on a daily basis, the technology for creating a more equitable and conservation oriented water rate structure is now within reach of all water districts.
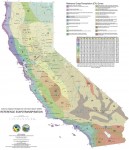
California ET rate map
Click on map to enlarge.

[wpdm_package id=179]