In a previous post I talked about how mobile apps are extracting data in order to build a digital profile of the user for the purpose of serving them targeted online advertising. But what about my website, insuremekevin.com? Is it collecting user data and profiting from it?

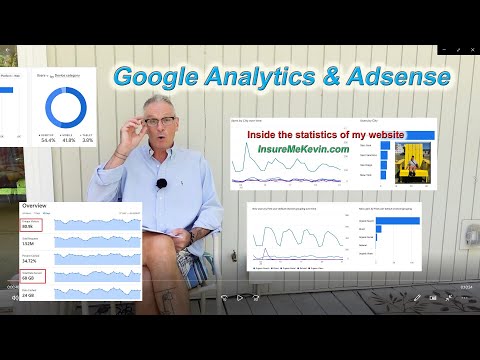
Google Analytics Statistics for InsureMeKevin
There are two pieces of code that are fired when someone clicks on my website. The first is for Google Analytics and the second is for Google Adsense. What does NOT happen is my website, insuremekevin.com, placing a cookie on the visitor’s device to gather information about the user.
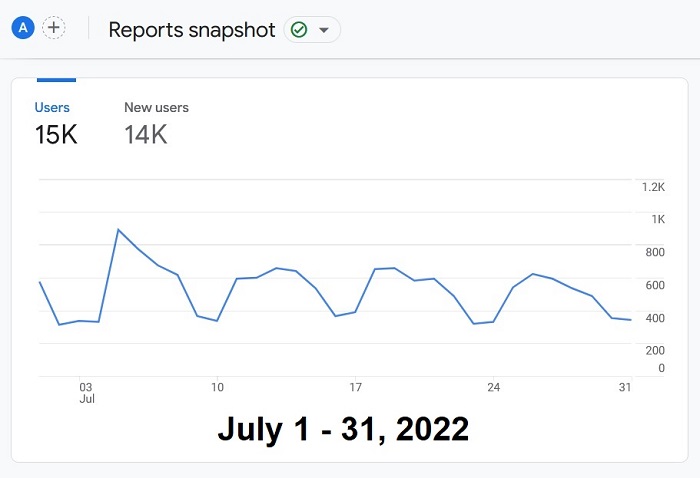
The limited information I get about visitors to my site comes from the Google Analytics tag. One of the first reports from Google Analytics I see are my visitor numbers. How many new and returning users by day, week or month. On average, there are approximately 500 people who visit my website every day.
Visitors by day, week, month
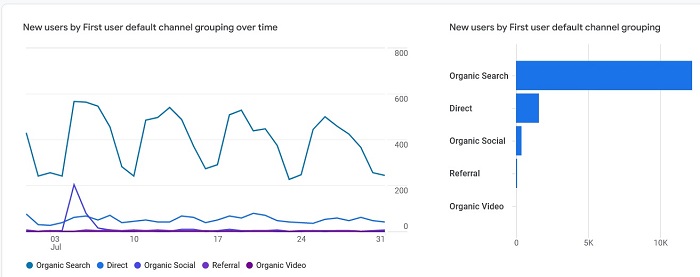
The referral data tells me how many people found my site through an organic search (typing a question into a search engine), direct by typing in my website address, or if someone clicked on my site because they saw it on social media. Most of my visitors find my website organically using a search engine.
Referral: organic, direct, social media
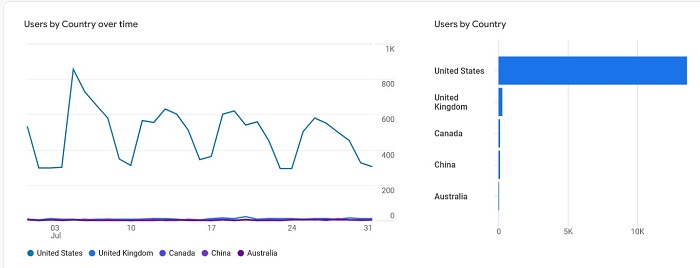
In terms of demographics, Google Analytics knows the location of the IP address for the device visiting my website. This allows me to learn that most of my visitors live in the United States.
Country of origin
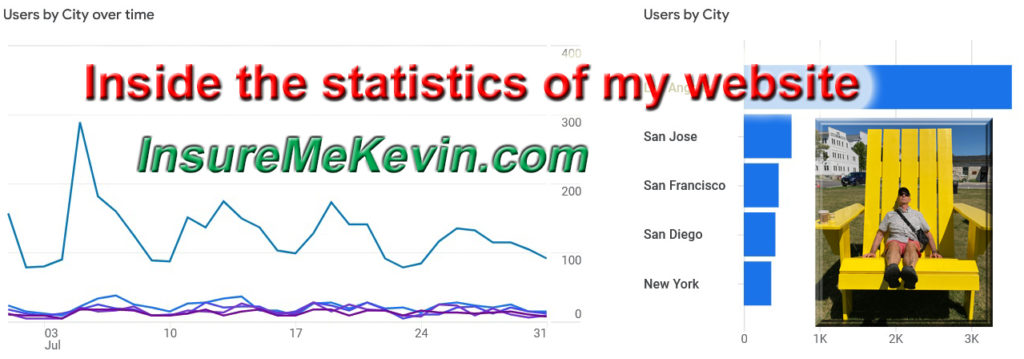
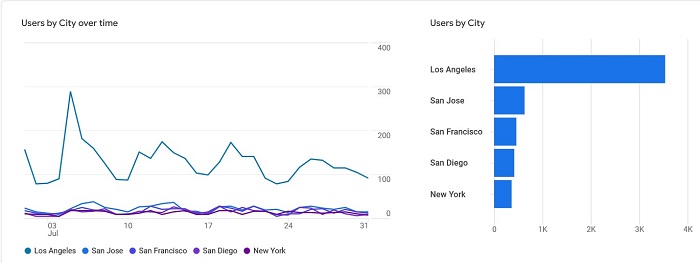
I can view visitors by city as well. Most of my visitors live in Los Angeles. The next biggest group of visitors by location is the Bay Area, San Jose and San Francisco.
Views by California cities

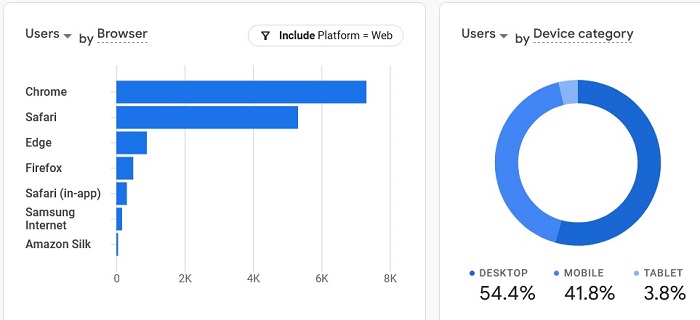
The technology information that is captured for me to review is the type of browser the device is using to view my website and type of device: desktop, mobile, or tablet.
Brand of internet browser and type of device
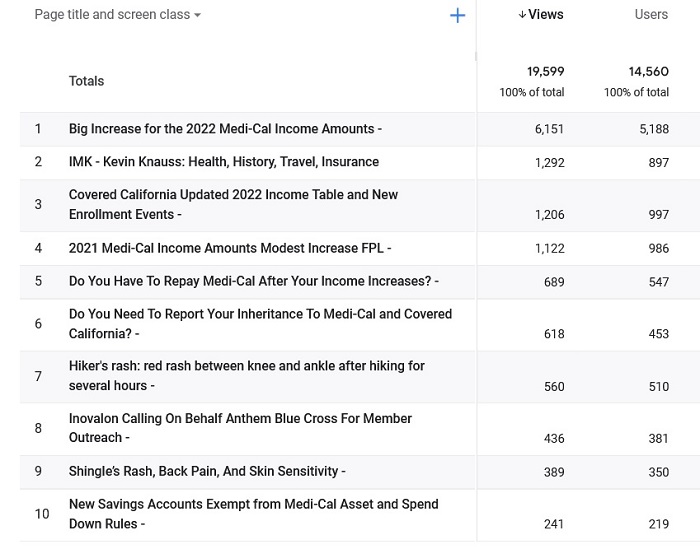
Perhaps the biggest piece of information Google Analytics captures for me are the unique pages and posts visitors are viewing. Five of the top ten pages viewed in July 2022 dealt with Medi-Cal. This is important data because it tells me what is of interest to people and I can develop content to answer their questions.
Top 10 most viewed posts
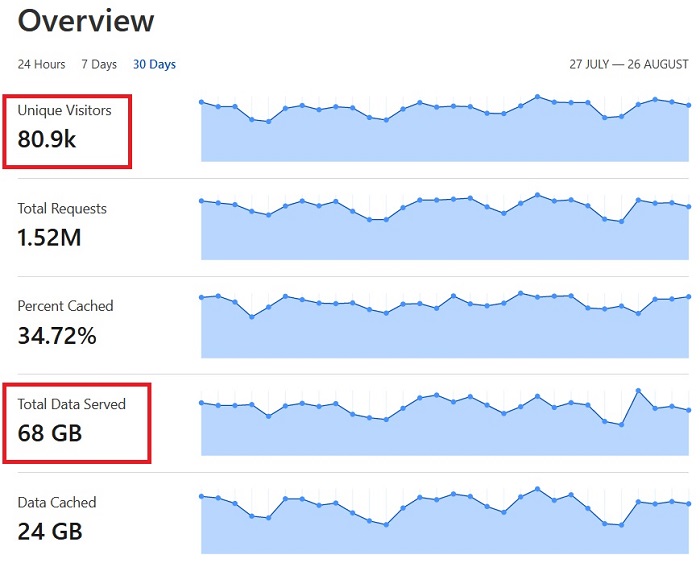
Another useful set of statistics comes from Cloudflare, the company that actually delivers the website content to visitors. For a 30-day period in July and August, they served 68 gigabytes of data to visitors. It is this large amount of data or bandwidth that necessitated I invest in a dedicated server to keep my website up and running. The inexpensive shared servers could not deliver the content and my website became slow or stopped working.
Bandwidth, amount of gigabytes served
Google Adsense Advertising Revenue
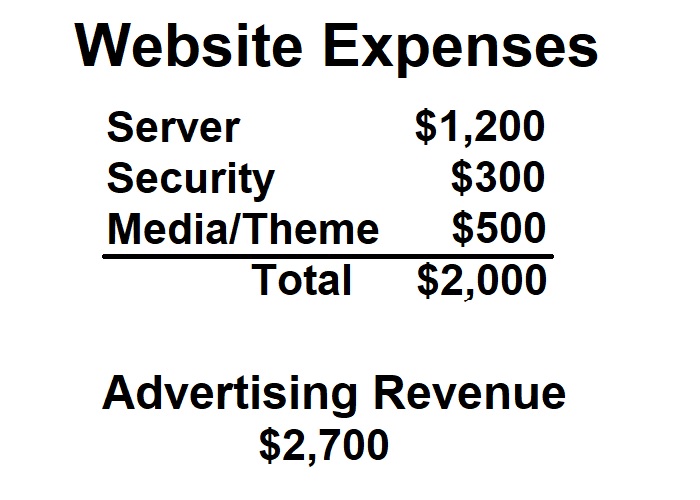
The dedicated server from WP Engine, security enhancements, and special media and theme handling elements total about $2,000 per year, just to keep the website operating. My revenue from the website advertising is approximately $2,700 per year. When you consider my time to maintain the website and the fixed costs, it is a breakeven proposition.
The next piece of code that fires on my website is for Google Adsense. Immediately, an online auction is triggered for advertisers when a URL is clicked for my website. Google Adsense tries to match the content of the page being visited with the preferences of the visitor and the advertiser. I have no control over what ads are shown.
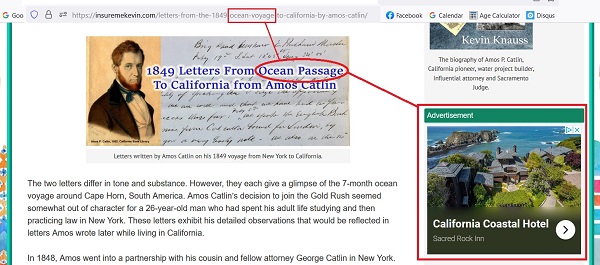
Part of the reason I decided to deploy advertising on the website was to defray the costs of the website. Also, my site is viewed in states where I don’t offer health insurance. If an ad is shown for an agent or health plan that the viewer in Texas is interested in, great. This generates a little revenue for the website so I can continue to post about Medi-Cal topics. Agents are not compensated for assisting people with Medi-Cal eligibility or enrollment.
In conclusion, when someone visits my website, I learn very little about the visitor. Most of the statistics I get are about the number of visits, page views, and popular topics. This data is important information to develop content and optimize the website for the best visitor experience. Online advertising can be very annoying. I don’t want to have the advertisements, but I have to defray the costs of maintaining the website.