

A five star Medicare Advantage will be paid $890 in Sacramento County, $947 in San Francisco County, $951 in Los Angeles County and $856 in San Diego County per month by the Centers for Medicare and Medicaid for each enrolled member. The data and calculations that go into determining the monthly reimbursement or capitation rate for Medicare Advantage (MA) Plans is complicated and subject to much debate. This monthly Medicare reimbursement rate is also the focus of how to curb the rise in the national expenditures on the Medicare program.
Medicare Advantage plans paid from calculated health care costs
Medicare publishes the rates that they will reimburse MA plans in each individual county for the United States, Guam, Puerto Rico, and the Virgin Islands. Plan sponsors, who could be health insurance companies or locally organized health plans, then design plans around that reimbursement rate. The Medicare plans benefits (deductibles, copayments, coinsurance, etc.) must be actuarially equivalent to the benefits and expenses that a Medicare beneficiary would realize if they opted for Original Medicare. In other words, the average Medicare beneficiary would not be monetarily hurt by enrolling in a Medicare Advantage plan over staying in Original Medicare.
Some plans receive higher reimbursements
There are many variations of the Medicare Advantage plans where a private entity or non-profit organization administers the Medicare benefits for members under an approved Medicare plan. The information in this post pertains to Medicare Advantage capitation rates for what Medicare identifies as the Aged and Disabled. “Aged” are Medicare beneficiaries who aged into the system at 65 or older. “Disabled” ane those individuals who received Parts A and B as a result of a disability. Other MA plans include PACE, SNP, MSA and PFFS.
Medicare Advantage to be based on actual health care costs
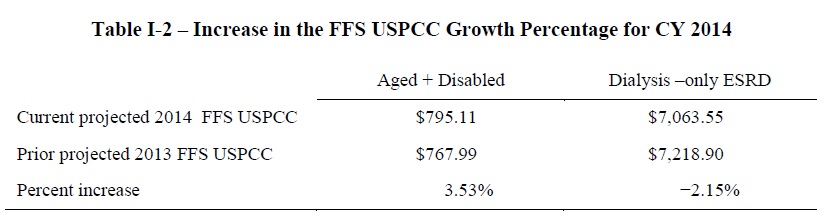
In 2013, when the Centers for Medicare and Medicaid (CMS) called for MA bids for 2014. They had already determined the average increased costs of health care services known as the Fee For Service United State Per Capita Cost (FFS USPCC) over the prior year. This is essentially the health care costs that CMS realized when they received the medical bills for individuals in Original Medicare. They take the FFS USPCC percentage increase which was 3.53% and modify it to determine a National Per Capita MA Growth Percent that was 2.96% for 2014. Medicare is slowly working toward a point where all the reimbursement rates for the Medicare Advantage plans will be based substantially upon the FFS USPCC rate. The following is an excerpt from the 2014 call letter for bids from CMS.
2014 Medicare Advantage Capitation Rates and MA and PDP Payment Policies
The Table I-1 below shows the National Per Capita MA Growth Percentages (NPCMAGP) for 2014. An adjustment of 0.77 percent for the combined aged and disabled is included in the NPCMAGP to account for corrections to prior years’ estimates as required by section 1853(c)(6)(C). The combined aged and disabled increase is used in the development of the rate book. 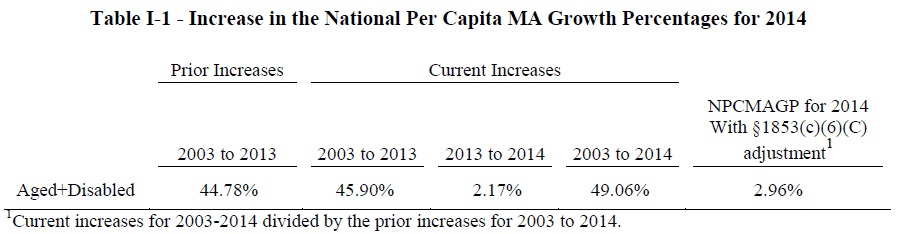


Medicare focus on annual health care costs
The costs for Medicare Parts A & B are broken down by county. For determining the capitation rate, CMS takes the average costs by county, applies a “Claims Processing Cost” and the MA adjustment factor to arrive at the final reimbursement rate per month. To be sure, this is an over-simplification of the process. There are reams of data that are gathered and analyzed before the average costs befor either Part A or B are determined.
Plan sponsors design MA plans around capitation rates
But essentially, CMS is saying to the Medicare Advantage plans that they will reimburse them the amount that an average Medicare beneficiary might incur in health care costs for a specific county. The plan sponsors then design health plans that meet the guidelines and consider whether they can manage the health care of the members so they spend less than the national average.
Star ratings increase monthly fed payments
As an incentive to keeping the MA members healthy and happy, CMS will reimburse higher monthly levels for better star ratings. Based on past performance of the MA-PD, CMS assigns a star rating to each plan. The monthly reimbursement is then tied to the archieved star rating. The higher the star rating, the more money the plan sponsor is reimbursed every month.
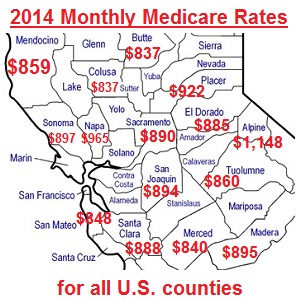
California Medicare Advantage reimbursements
This is a sample of the spread for counties in California. Medicare Advantage plans will not be offered in all counties. If a Medicare MA plan is offered, this is the reimbursement or capitation rate CMS will pay for each enrolled member for the Part A and B portion of Medicare. There is an additional reimbursement if the plan includes the prescription drug portion or PDP. These plans are known as MA-PD.
Medicare Advantage Monthly Capitation Rates in dollars for 2014 for All Plans |
||||||
| Except PACE Plans –All rates include MIPPA IME deduction. | ||||||
| *MA-PD plans are not available in all counties | ||||||
| Risk Parts A & B | ||||||
| State – County | 5 Star | 4.5 Star | 4 Star | 3.5 Star | 3 Star | <=2.5 Star |
| California | ||||||
| ALAMEDA | 949.60 | 949.60 | 949.60 | 935.73 | 931.11 | 903.36 |
| ALPINE | 1,148.39 | 1,148.39 | 1,148.39 | 1,131.98 | 1,126.52 | 1,093.71 |
| AMADOR | 871.86 | 871.86 | 871.86 | 860.01 | 856.07 | 832.39 |
| BUTTE | 837.92 | 837.92 | 837.92 | 826.36 | 822.51 | 799.39 |
| CALAVERAS | 922.21 | 922.21 | 922.21 | 909.04 | 904.64 | 878.30 |
| COLUSA | 837.88 | 837.88 | 837.88 | 826.49 | 822.70 | 799.93 |
| CONTRA COSTA | 990.39 | 990.39 | 990.39 | 975.93 | 971.11 | 942.18 |
| DEL NORTE | 831.17 | 831.17 | 831.17 | 820.38 | 816.79 | 795.22 |
| EL DORADO | 885.34 | 885.34 | 885.34 | 861.19 | 853.15 | 804.86 |
| FRESNO | 914.74 | 914.74 | 914.74 | 890.56 | 882.50 | 834.16 |
| GLENN | 825.79 | 825.79 | 825.79 | 814.00 | 810.06 | 965.00 |
| HUMBOLDT | 807.19 | 807.19 | 807.19 | 796.43 | 792.84 | 771.31 |
| IMPERIAL | 829.23 | 829.23 | 829.23 | 818.17 | 814.48 | 792.37 |
| INYO | 937.49 | 937.49 | 937.49 | 923.43 | 918.74 | 890.62 |
| KERN | 867.55 | 867.55 | 867.55 | 855.15 | 851.02 | 826.24 |
| KINGS | 830.56 | 830.56 | 830.56 | 818.70 | 814.74 | 791.01 |
| LAKE | 961.01 | 961.01 | 961.01 | 946.97 | 942.29 | 914.23 |
| LASSEN | 866.01 | 866.01 | 866.01 | 853.02 | 848.69 | 822.71 |
| LOS ANGELES | 951.29 | 951.29 | 951.29 | 937.21 | 932.52 | 904.36 |
| LOS ANGELES | 951.29 | 951.29 | 951.29 | 937.21 | 932.52 | 904.36 |
| MADERA | 895.14 | 895.14 | 895.14 | 872.40 | 864.81 | 819.33 |
| MARIN | 898.58 | 898.58 | 898.58 | 885.27 | 880.83 | 854.22 |
| MARIPOSA | 875.90 | 875.90 | 875.90 | 863.38 | 859.21 | 834.19 |
| MENDOCINO | 859.46 | 859.46 | 859.46 | 848.00 | 844.18 | 821.26 |
| MERCED | 840.24 | 840.24 | 840.24 | 829.04 | 825.30 | 802.90 |
| MODOC | 880.01 | 880.01 | 880.01 | 867.76 | 863.68 | 839.18 |
| MONO | 948.31 | 948.31 | 948.31 | 934.45 | 929.82 | 902.10 |
| MONTEREY | 897.21 | 897.21 | 897.21 | 884.09 | 879.72 | 853.49 |
| NAPA | 965.55 | 965.55 | 965.55 | 951.45 | 946.76 | 918.56 |
| NEVADA | 840.84 | 840.84 | 840.84 | 829.25 | 825.38 | 802.18 |
| ORANGE | 895.77 | 895.77 | 895.77 | 882.51 | 878.09 | 851.57 |
| PLACER | 888.88 | 888.88 | 888.88 | 866.29 | 858.75 | 813.56 |
| PLUMAS | 922.36 | 922.36 | 922.36 | 909.04 | 904.60 | 877.95 |
| RIVERSIDE | 911.76 | 911.76 | 911.76 | 898.59 | 894.20 | 867.86 |
| SACRAMENTO | 890.09 | 890.09 | 890.09 | 867.96 | 860.58 | 816.33 |
| SAN BENITO | 908.51 | 908.51 | 908.51 | 895.38 | 891.00 | 864.74 |
| SAN BERNARDINO | 896.16 | 896.16 | 896.16 | 883.07 | 878.70 | 852.51 |
| SAN DIEGO | 856.33 | 856.33 | 856.33 | 844.10 | 840.02 | 815.56 |
| SAN FRANCISCO | 947.92 | 947.92 | 947.92 | 922.83 | 914.47 | 864.30 |
| SAN JOAQUIN | 894.36 | 894.36 | 894.36 | 871.12 | 863.37 | 816.88 |
| SAN LUIS OBISPO | 829.37 | 829.37 | 829.37 | 818.31 | 814.63 | 777.41 |
| SAN MATEO | 848.70 | 848.70 | 848.70 | 836.57 | 832.53 | 808.28 |
| SANTA BARBARA | 845.60 | 845.60 | 845.60 | 834.63 | 830.97 | 809.03 |
| SANTA CLARA | 888.53 | 888.53 | 888.53 | 875.83 | 871.60 | 846.22 |
| SANTA CRUZ | 847.16 | 847.16 | 847.16 | 835.06 | 831.03 | 806.82 |
| SHASTA | 977.07 | 977.07 | 977.07 | 963.11 | 958.46 | 930.55 |
| SIERRA | 896.00 | 896.00 | 896.00 | 883.53 | 879.37 | 851.18 |
| SISKIYOU | 852.83 | 852.83 | 852.83 | 841.78 | 838.10 | 816.00 |
| SOLANO | 910.82 | 910.82 | 910.82 | 897.81 | 893.47 | 867.45 |
| SONOMA | 897.31 | 897.31 | 897.31 | 872.84 | 864.68 | 815.74 |
| STANISLAUS | 960.06 | 960.06 | 960.06 | 934.27 | 925.67 | 874.09 |
| SUTTER | 867.25 | 867.25 | 867.25 | 856.41 | 852.80 | 814.09 |
| TEHAMA | 839.24 | 839.24 | 839.24 | 827.25 | 823.25 | 799.28 |
| TRINITY | 891.30 | 891.30 | 891.30 | 878.56 | 874.32 | 848.86 |
| TULARE | 866.68 | 866.68 | 866.68 | 854.91 | 850.98 | 827.44 |
| TUOLUMNE | 860.21 | 860.21 | 860.21 | 848.74 | 844.92 | 821.98 |
| VENTURA | 921.55 | 921.55 | 921.55 | 908.38 | 903.99 | 877.67 |
| YOLO | 887.01 | 887.01 | 887.01 | 864.19 | 856.58 | 810.94 |
| YUBA | 879.34 | 879.34 | 879.34 | 867.94 | 864.14 | 841.33 |
Aged and Disabled capitation rates
The following table from 2014 MA Rate Book shows all the reimbursement or capitation rates for all the counties. These are the rates for the medical portion of the Medicare Advantage plan and do not include the Part D Prescription plan that many MA’s include known as MA-PDs. They are also only the rates for the Aged and Disabled. There are separate rates for people who suffer from End Stage Renal Disease (ESRD) and need weekly dialysis. 2014 Medicare Advantage capitation rates for all counties in the U.S. including Guam, Puerto Rico, and the U.S. Virgin Islands [gview file=”https://insuremekevin.com/wp-content/uploads/2014/07/2014-County-MA-Rates.xlsx” save=”1″]
2014 Medicare announcements and spreadsheet data
The following files were downloaded from the CMS website and were the foundation for the above U.S. County MA Rates spreadsheet. [wpfilebase tag=browser id=21 /]