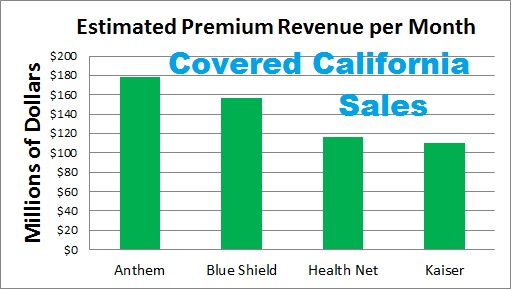
With a peek at the enrollment statistics released by Covered California after the end of the ACA open enrollment we are able to visualize just how large the health insurance industry is in the state. While the enrollment data is only for individual and family plans (IFP) purchased through Covered California, the 1.3 million individuals in those health plans are generating an estimated $593 million in monthly premiums. When you add the 1.9 million people enrolled in expanded Medi-Cal you get a whopping $1.7 billion being paid to health plans every month in California because of the Affordable Care Act. Download Covered California press release and Premium Revenue Spreadsheet at end of post.
| Members* | Monthly Premiums | |
| Anthem Blue Cross | 425,058 | $177,892,823 |
| Blue Shield of California | 381,457 | $156,628,333 |
| Chinese Community Health Plan | 14,306 | $6,541,107 |
| Contra Costa Health Plan | 1,091 | $546,942 |
| Health Net | 264,079 | $115,634,307 |
| Kaiser | 241,098 | $109,496,567 |
| L.A. Care Health Plan | 38,124 | $13,969,498 |
| Molina Healthcare | 11,731 | $4,262,178 |
| Sharp Health Plan | 13,087 | $5,738,611 |
| Valley Health Plan | 1,891 | $904,036 |
| Western Health Advantage | 4,007 | $2,219,122 |
| Totals | 1,395,929 | $593,833,525 |
| Expanded Medi-Cal | 1,900,000 | $1,160,900,000 |
| Estimated Monthly Premium | Total | $1,754,733,525 |
*Membership based on enrollment data released by Covered California. Monthly premium revenue estimated by using the Covered California released data on the distribution of members by age range and distribution of metal tier plans selected by all members receiving APTC.
Covered California generates $593 million in monthly premiums
It has always been hard to gauge the size of the IFP market in California because of the numerous health plans and the variety of different reports they must generate. All the data exists, but you have to know which regulatory filing with which agency contains the information. Release of the high level Covered California enrollment data gives us a good snap shot of health plan market share along with the type of plans people purchased. From the coarse data provided by Covered California we can begin to estimate, among other things, the monthly premium revenue collected by each of the carriers. The downside is that the data is condensed in many areas making it difficult achieve much precision with a high level of confidence.
Covered California data helps generate estimate
The three important pieces of enrollment data released for the purposes of gauging the economic scale associated with IFP in California are enrollment by carrier, distribution by age, and distribution by metal level plan. Those three data sets can be used to estimate the monthly health insurance premiums collected by the carriers. The weakest data is the age distribution because Covered California has provided enrollment by age ranges. Because each age has a specific premium rate associated with it, the accuracy of the premium revenue will be reduced by using either one rate or an average rate in the age band.
19 regions and hundreds of different rates by age
Perhaps a bigger wild card for estimating monthly premiums is that Covered California gave us no distribution of enrollment between the different rating regions. The carriers can have a 10% price difference for the same plan at the same age just between regions that might be next to one another. However, it is important to remember that the data released is but a snap shot in time. Individuals are constantly coming into the exchange, leaving, moving to other regions and changing plans.
MLR keeps premium revenue in California
Aside from the inherent limitations of the data, it can still give us some ball park revenue projections when we crunch the numbers with certain assumptions. The estimated $593 million in premium revenue will primarily stay in California. Because of the ACA Medical Loss Ratio (MLR) rules, close to 80% of these premium dollars will be returned to the California health care system. That means every month approximately $474 million are flowing into hospitals, labs, outpatient facilities and into the pockets of doctor’s offices.
How I estimated health plan monthly premium revenue
While I knew the total members, the age and plan distribution, it was still necessary to add a premium rate to the calculations for each of the carriers. Using Western Health Advantage (WHA) in Sacramento as an example, the first questions I had to ask when looking at the data was of their 4007 members; what was their ages, what plan did they pick and where did they live. Those three specific pieces of information determine the rate. Once I know the monthly premium rate of all 4007 individuals that purchased a WHA plan through Covered California I can estimate the total monthly premium paid to WHA.
Age and plan percentages applied equally
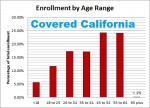
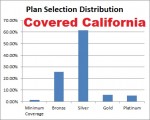
While not perfect, I applied the statewide age distribution percentages to break up the carrier enrollment within the different age bands. Undoubtedly there are carriers that are favored more heavily by certain age groups than other carriers. This would mean that a particular carrier’s age distribution is different from another. Absent specific carrier information, I had to go with the statewide condensed percentages by age range. This situation also applied to assigning the membership into the different metal tier health plans. Even though 48% of the health plans purchased through Covered California were by people 45 years and older, including the weighted rates of younger individuals will give a more accurate estimated of the premium revenue.
| Western Health Advantage | Plan Distribution | ||||||
| Age | Distribution | Carrier Enrollment | Catastrophic | Bronze | Silver | Gold | Platinum |
| Percentage | 4,007 | 1.41% | 25.74% | 61.67% | 5.97% | 5.21% | |
| <18 | 5.59% | 224 | 3.16 | 57.66 | 138.14 | 13.37 | 11.67 |
| 18 to 25 | 11.59% | 464 | 6.55 | 119.54 | 286.40 | 27.73 | 24.20 |
| 26 to 34 | 17.27% | 692 | 9.76 | 178.12 | 426.76 | 41.31 | 36.05 |
| 35 to 44 | 17.11% | 686 | 9.67 | 176.47 | 422.81 | 40.93 | 35.72 |
| 45 to 54 | 24.24% | 971 | 13.70 | 250.01 | 599.00 | 57.99 | 50.60 |
| 55 to 64 | 24.11% | 966 | 13.62 | 248.67 | 595.79 | 57.68 | 50.33 |
| 65 plus | 0.10% | 4 | 0.06 | 1.03 | 2.47 | 0.24 | 0.21 |
Covered California reported that 5.59% of all enrollments were for individuals under 18 years old. They also reported 1.41% of the individuals purchased minimum coverage or the Catastrophic plan. For WHA that means (5.59% x 4007) x 1.41% yields 3.16 members under 18 years old.
**The under 18 year old demographic is under represented at Covered California because families with incomes less than 250% of the federal poverty line automatically had their children enrolled in Medi-Cal while the parents were offered tax credits to purchased private health plans through the exchange.
Multiple rating regions problem
The problem of the residency, or what region members lived in, is most acute with statewide carriers that serve several regions. WHA sells plans in regions 2 and 3. Each has specific rates by plan and by age. Where possible, I chose to use the region that would most likely have the highest percentage of enrollment for the carrier. In the case of WHA that was region 3. For the other statewide health plans I settled on Region 16 in Los Angeles County because those rates were neither highest nor the lowest in the state. In addition, Los Angeles has the highest population of any county and therefore would have a disproportionately high number of Covered California enrollments.
| Premiums by Age | |||||||
| Western Health Advantage | |||||||
| Plan | <18 | 25 | 34 | 44 | 54 | 64 | >65 |
| Catastrophic | 114.33 | 180.77 | 218.58 | 251.53 | 384.41 | 540.15 | 540.15 |
| Bronze | 140.24 | 221.73 | 268.11 | 308.52 | 471.51 | 662.54 | 662.54 |
| Silver | 203.67 | 322.02 | 389.38 | 448.07 | 684.78 | 962.22 | 962.22 |
| Gold | 237.03 | 374.77 | 453.16 | 521.46 | 796.94 | 1,119.81 | 1,119.81 |
| Platinum | 257.17 | 406.61 | 491.66 | 565.77 | 864.65 | 1,214.97 | 1,214.97 |
| Western Health Advantage Region 3 | |||||||
| Bronze in non H.S.A plans | |||||||
Spreadsheet combines members, plans and rates
Once I had the number of members by age enrolled in each plan, with the corresponding rate, it was simple to create a function to estimate the monthly premium revenue.
| Western Health Advantage | ||||||
| Estimated Monthly Premium Revenue by Age and Plan | ||||||
| Age | Catastrophic | Bronze | Silver | Gold | Platinum | Totals |
| <18 | $361 | $8,086 | $28,134 | $3,170 | $3,001 | $42,752 |
| 25 | $1,184 | $26,505 | $92,227 | $10,391 | $9,838 | $140,145 |
| 34 | $2,133 | $47,757 | $166,173 | $18,721 | $17,726 | $252,509 |
| 44 | $2,432 | $54,445 | $189,448 | $21,343 | $20,209 | $287,877 |
| 54 | $5,265 | $117,883 | $407,983 | $46,212 | $43,755 | $621,097 |
| 64 | $7,358 | $164,754 | $573,277 | $64,586 | $61,153 | $871,129 |
| >65 | $31 | $683 | $2,378 | $268 | $254 | $3,613 |
| Monthly | Estimate | Total | $2,219,122 | |||
From the age distribution data for WHA, 3.16 individual under 18 were enrolled in the Catastrophic plan. The rate for the Catastrophic plan for under 18 years old is $114.33 found on the rate spreadsheet for region 3. 3.16 x $114.33 = $361.28 per month. To extrapolate the monthly premium estimates into a calendar year annual amount is easy but would be wrong. More than one-third of all enrollments through Covered California were for less than a full year. This is because many individuals and families didn’t enroll until March for an April effective date.
Average Covered California premium is reasonable
Under my gross premium revenue estimates, the average premium is $425.40 ($593,833,525 divided by 1,395,929). If you look across the various rates for the most popular plan, Silver, for the age band with the most enrollment, 45 to 54, the rates range from the mid $350 up to $500. So the estimate is at least approximating the rates in the real world. We can then contrast this to the average Medi-Cal capitated rate of $611 per month. (See: Average Medi-Cal premium is $611 per month). The expanded Medi-Cal rate trends higher because it includes both pediatric and adult dental insurance. Health plans purchased through Covered California include no dental for either children or adults.
Everyone wants a piece of the premium revenue pie
Between the estimated $593 million paid for private health insurance monthly coupled with the $1.1 billion for expanded Medi-Cal, there is over $1.7 billion in economic activity being generated every month by health insurance. To me, this is utterly staggering and only part of the picture. There is also the group health market that actually provides health insurance to most Californians. The good news is that most all of this premium revenue is circulating from individual, families and employers to the carriers and then back out to doctors, hospitals and labs that employ people. The bad news is that this health insurance economic engine is so big it is ripe for fraud, waste, abuse and excessive CEO salaries.
Assumptions
- The reported Covered California enrollment by age distribution is consistent across all the plans.
- The reported Covered California enrollment by plan distribution is consistent across all the plans.
Notes
- The age and plan enrollment distributions were applied the same to all plans.
- When available, the carrier’s rate sheet was used. Otherwise, rates were determined with the Covered California Shop and Compare Tool. Bronze plan rates were used for the Catastrophic rates when the latter was not available.
- Region 16 was the default region for carriers that offered plans statewide.
- Bronze plan rate does not include the H.S.A. plans
- The age range or band rate is not weighted. I used the highest age and rate within each range. For example, the 26 to 34 age band uses the rate for a 34 year old.
- The distribution of age bands and plans was applied equally to all carriers. No effort was made to “zero” out a partial monthly premium amounts. For example, Covered California reported .10% of the enrollments were from individuals 65+ years of age. Additionally, 1.41% of all applicants enrolled in a catastrophic plan. Based on the small enrollment of the some carriers, (.10% x 1.41%) results a fraction of an individual.
- SHOP enrollment is not included.
- Pediatric dental plan premiums are not included.
[wpfilebase tag=file id=39 /]
[wpfilebase tag=file id=40 /]


